
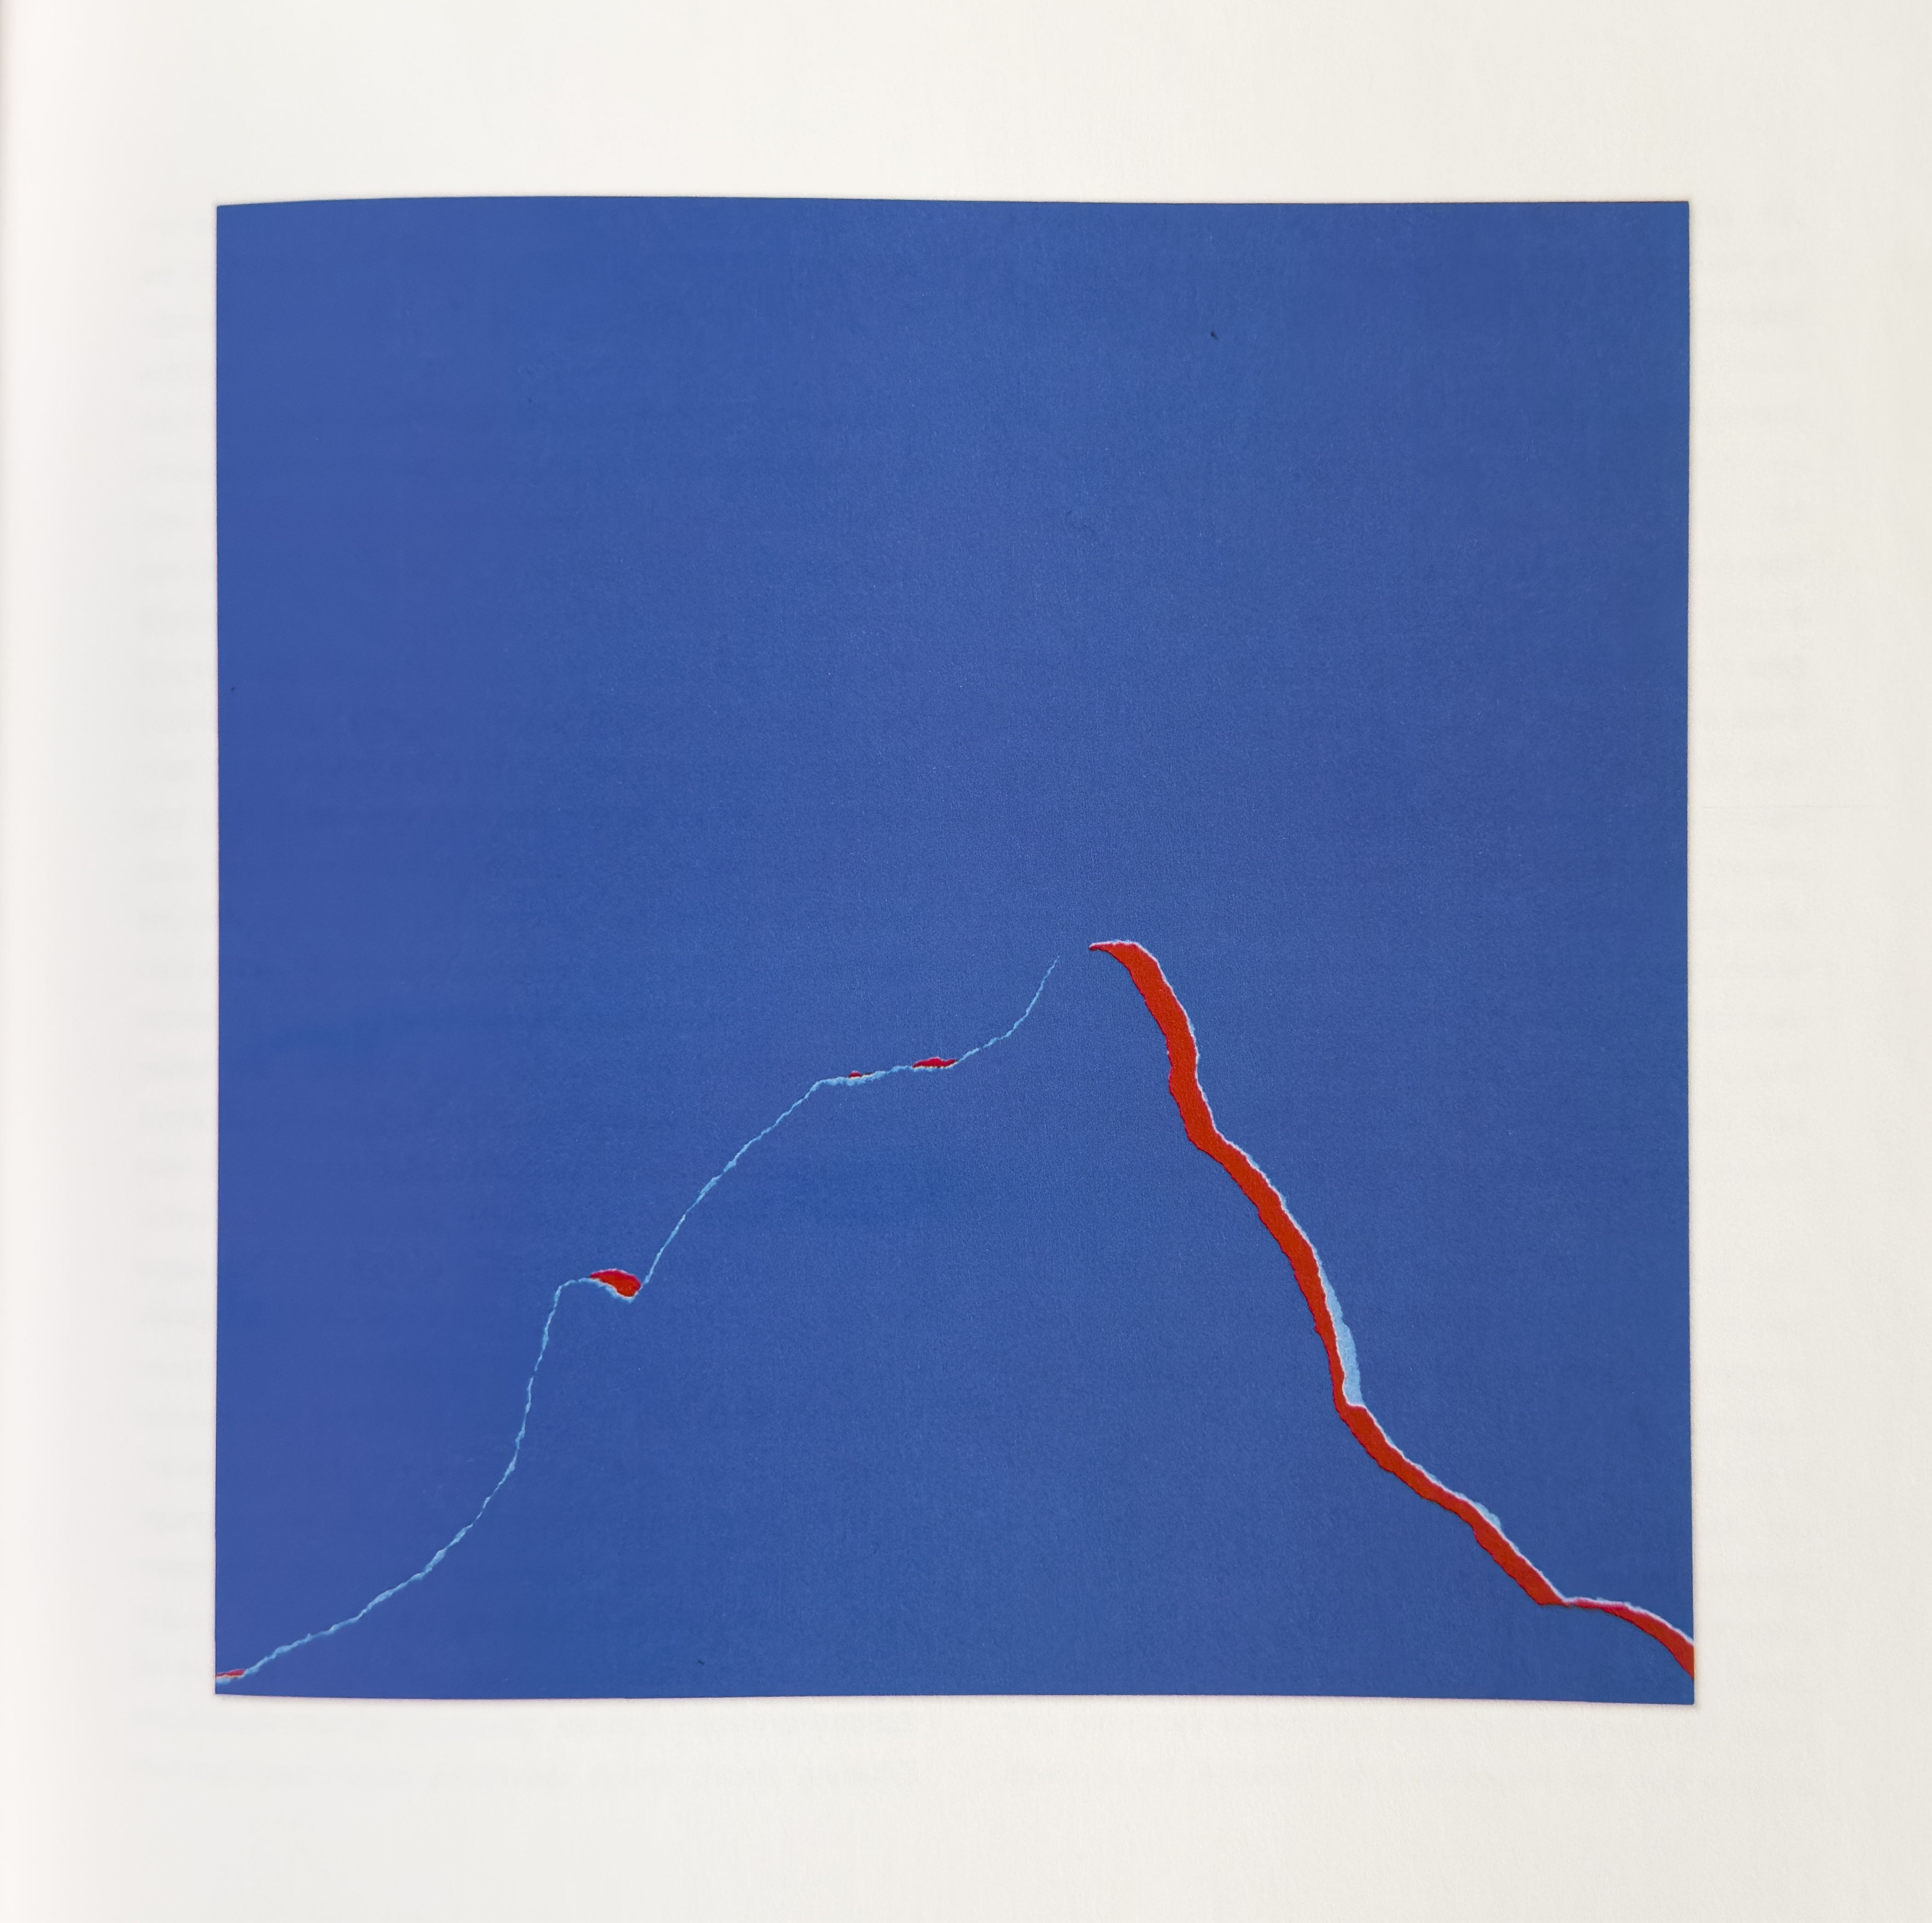
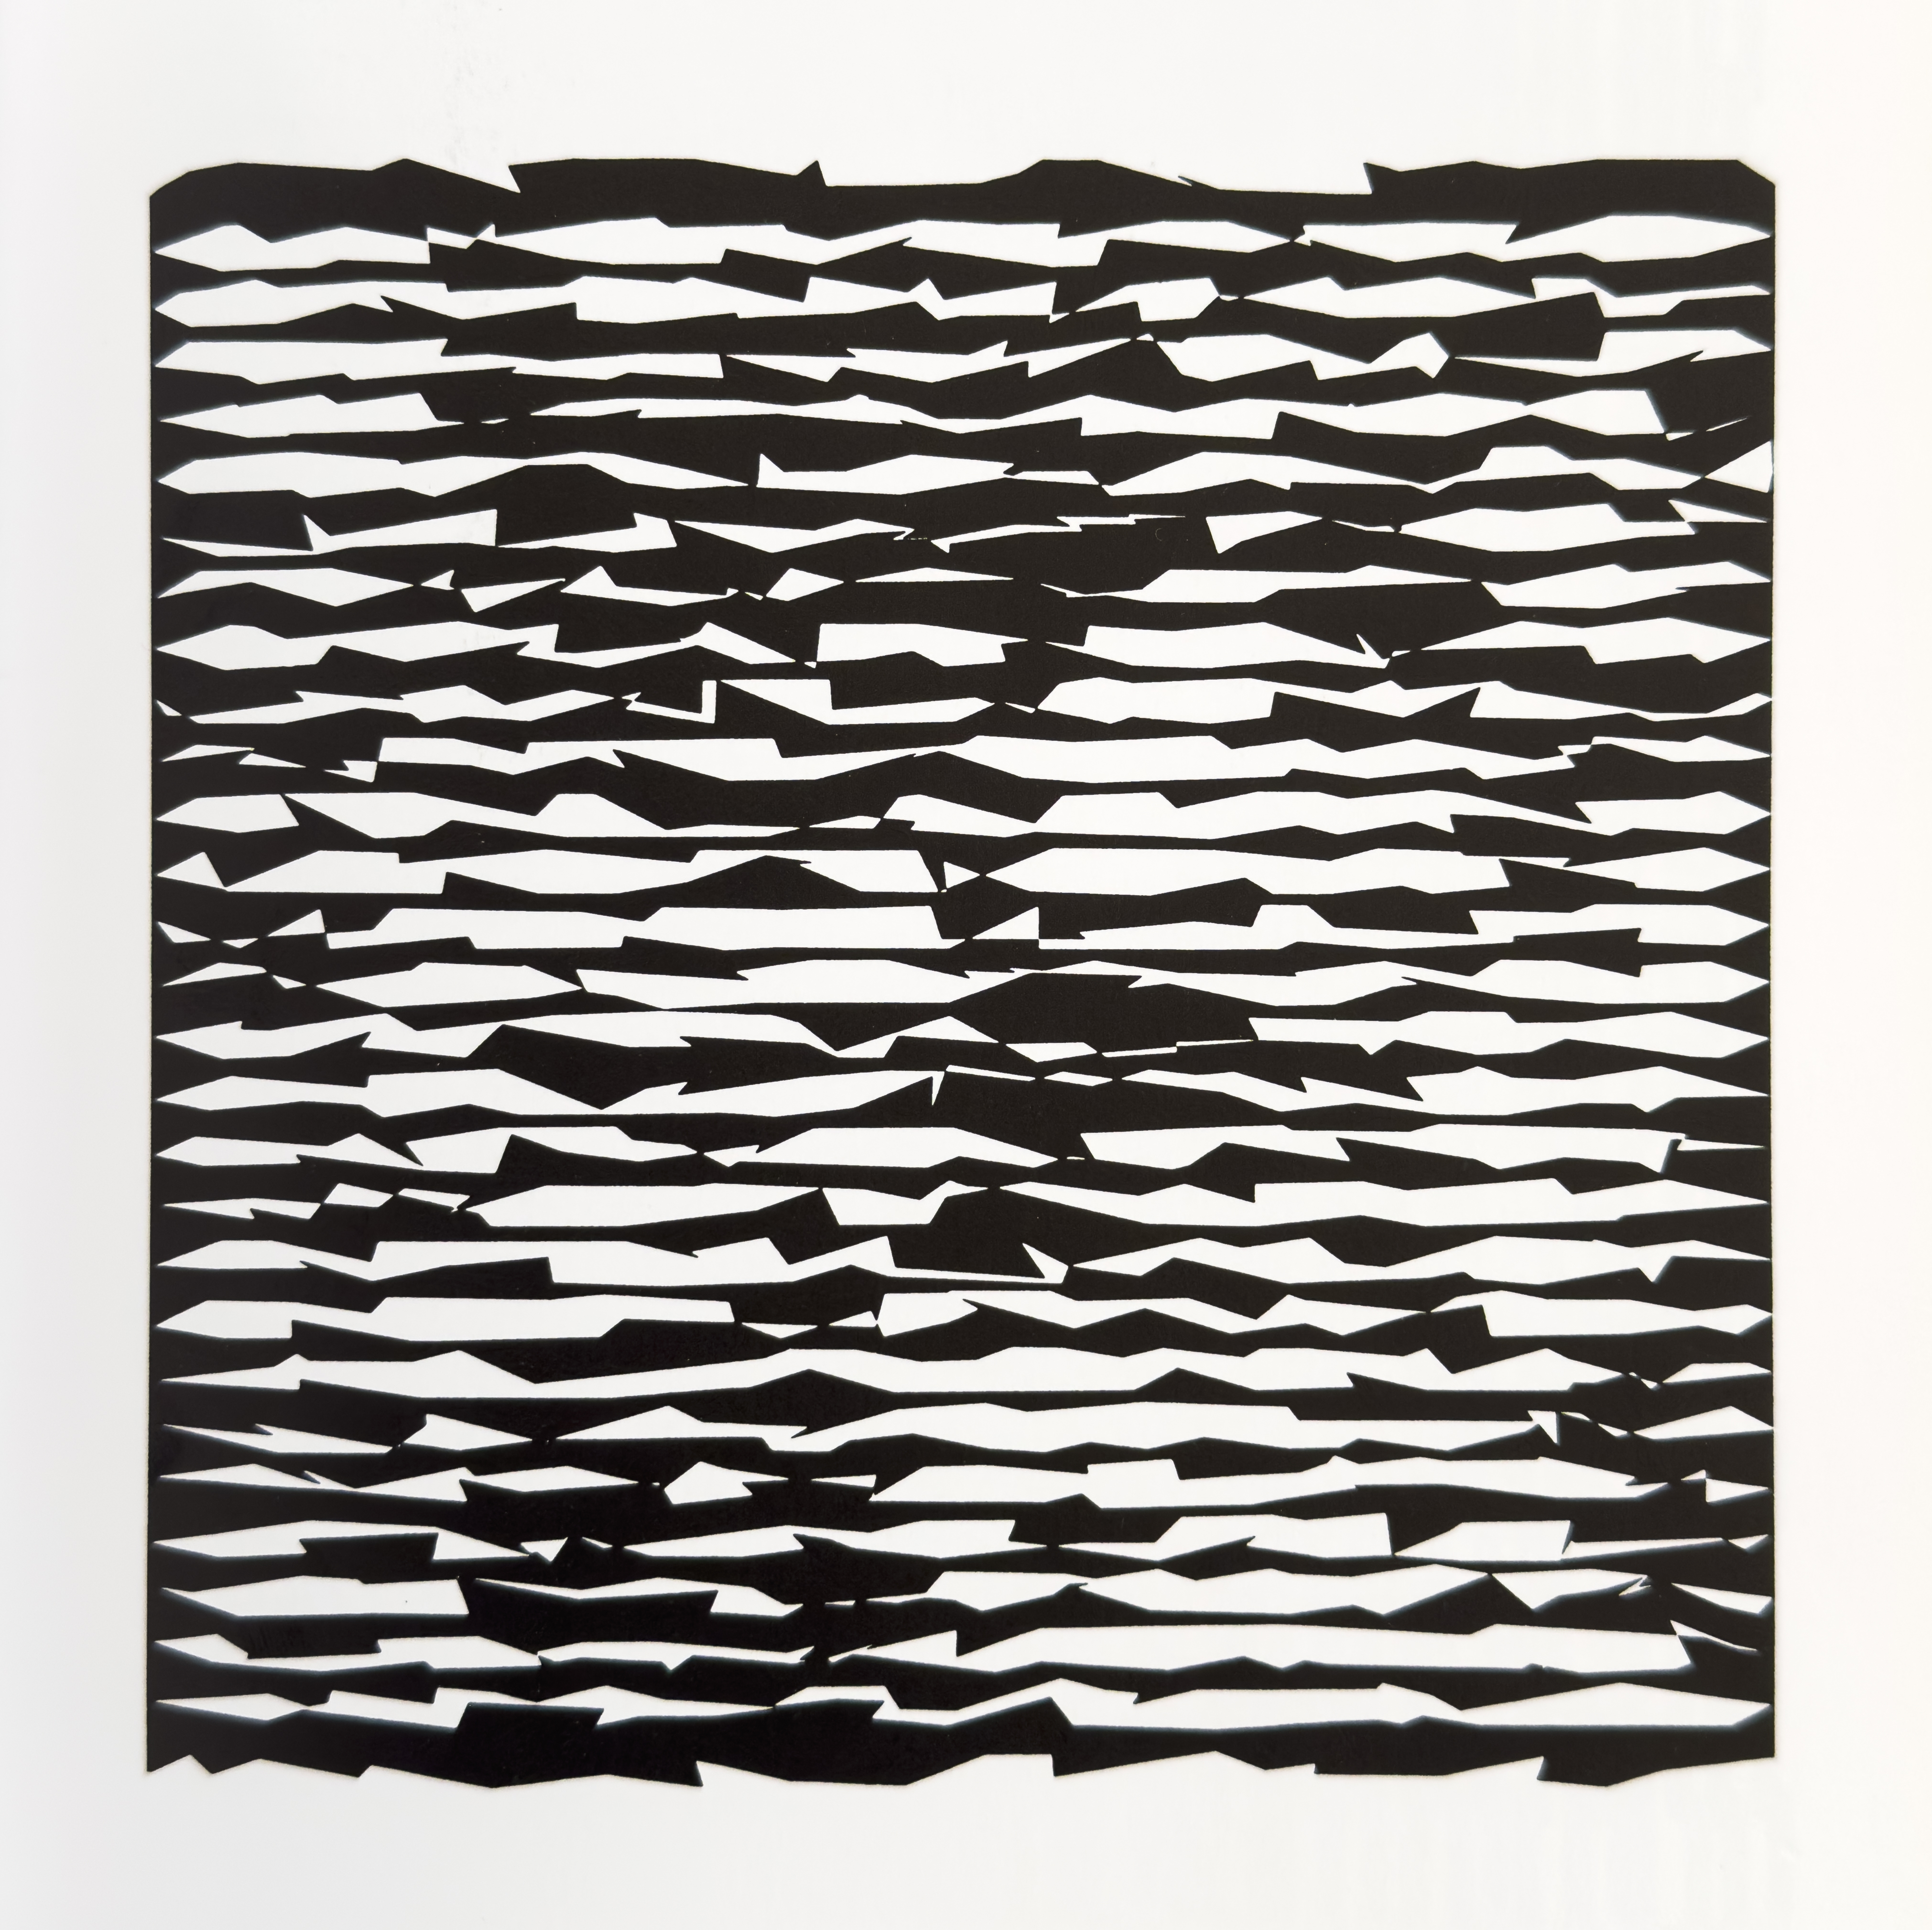
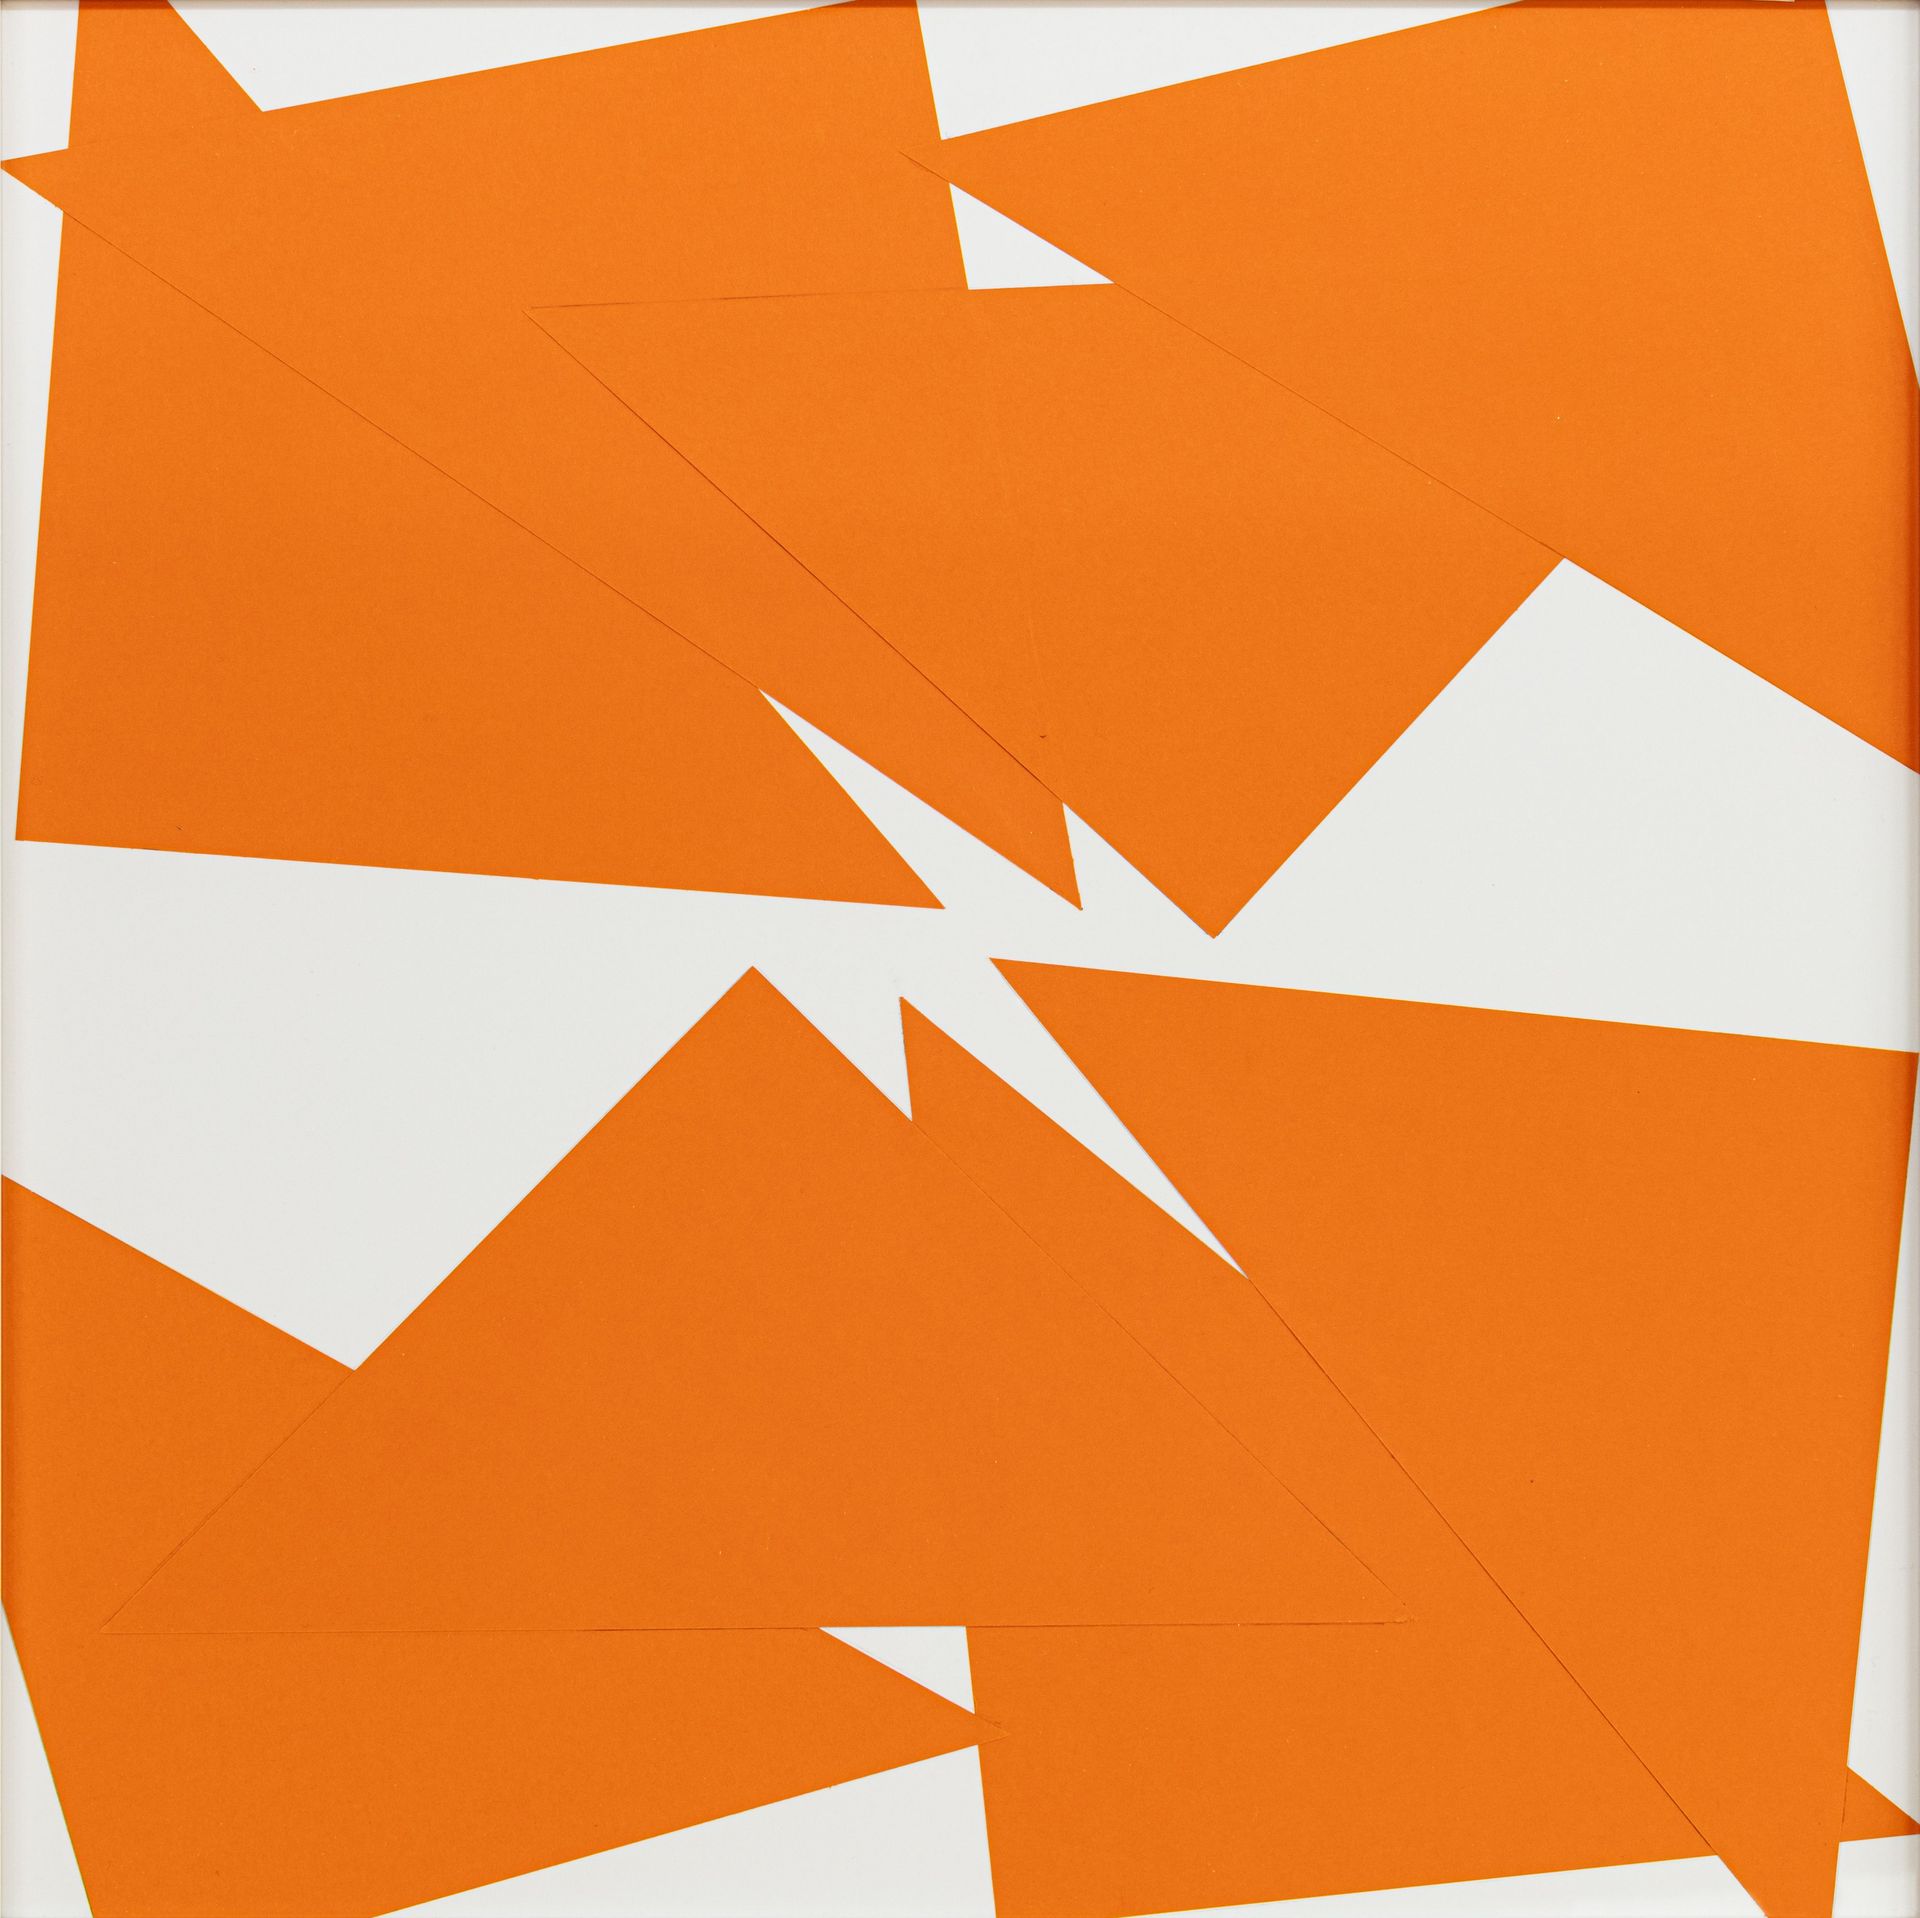
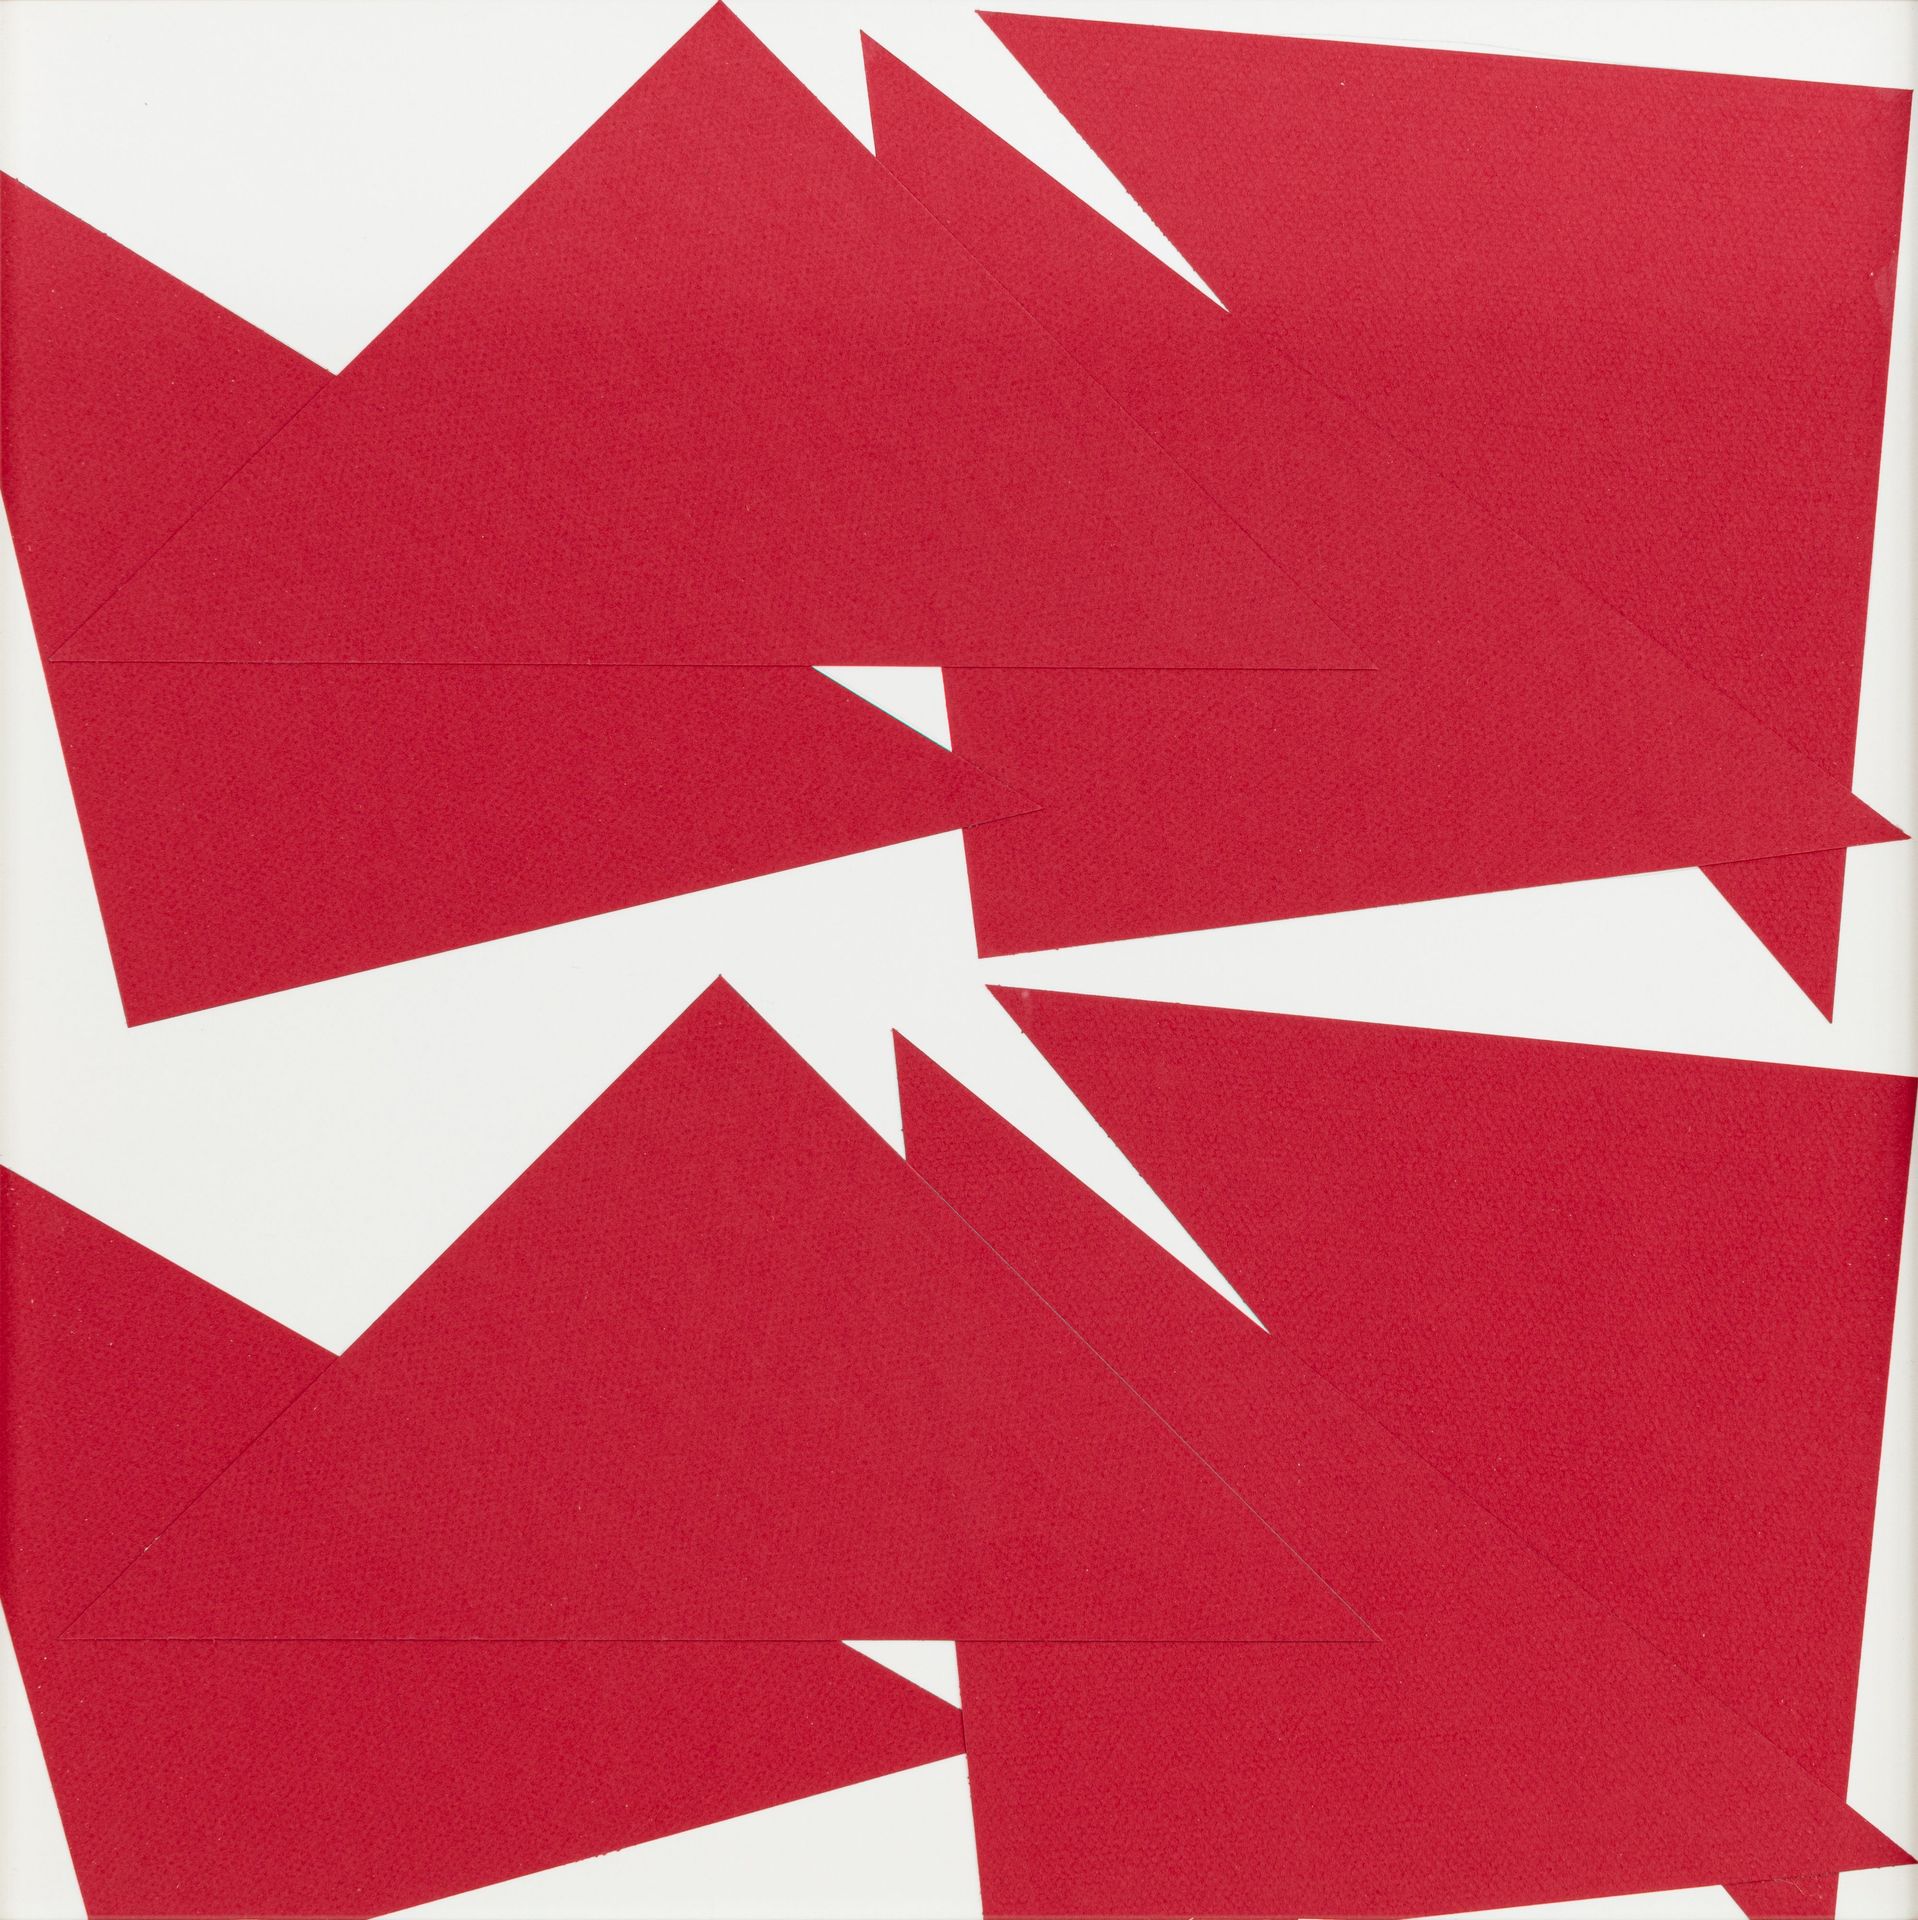
Composition no.94
(Vertical Line Test)
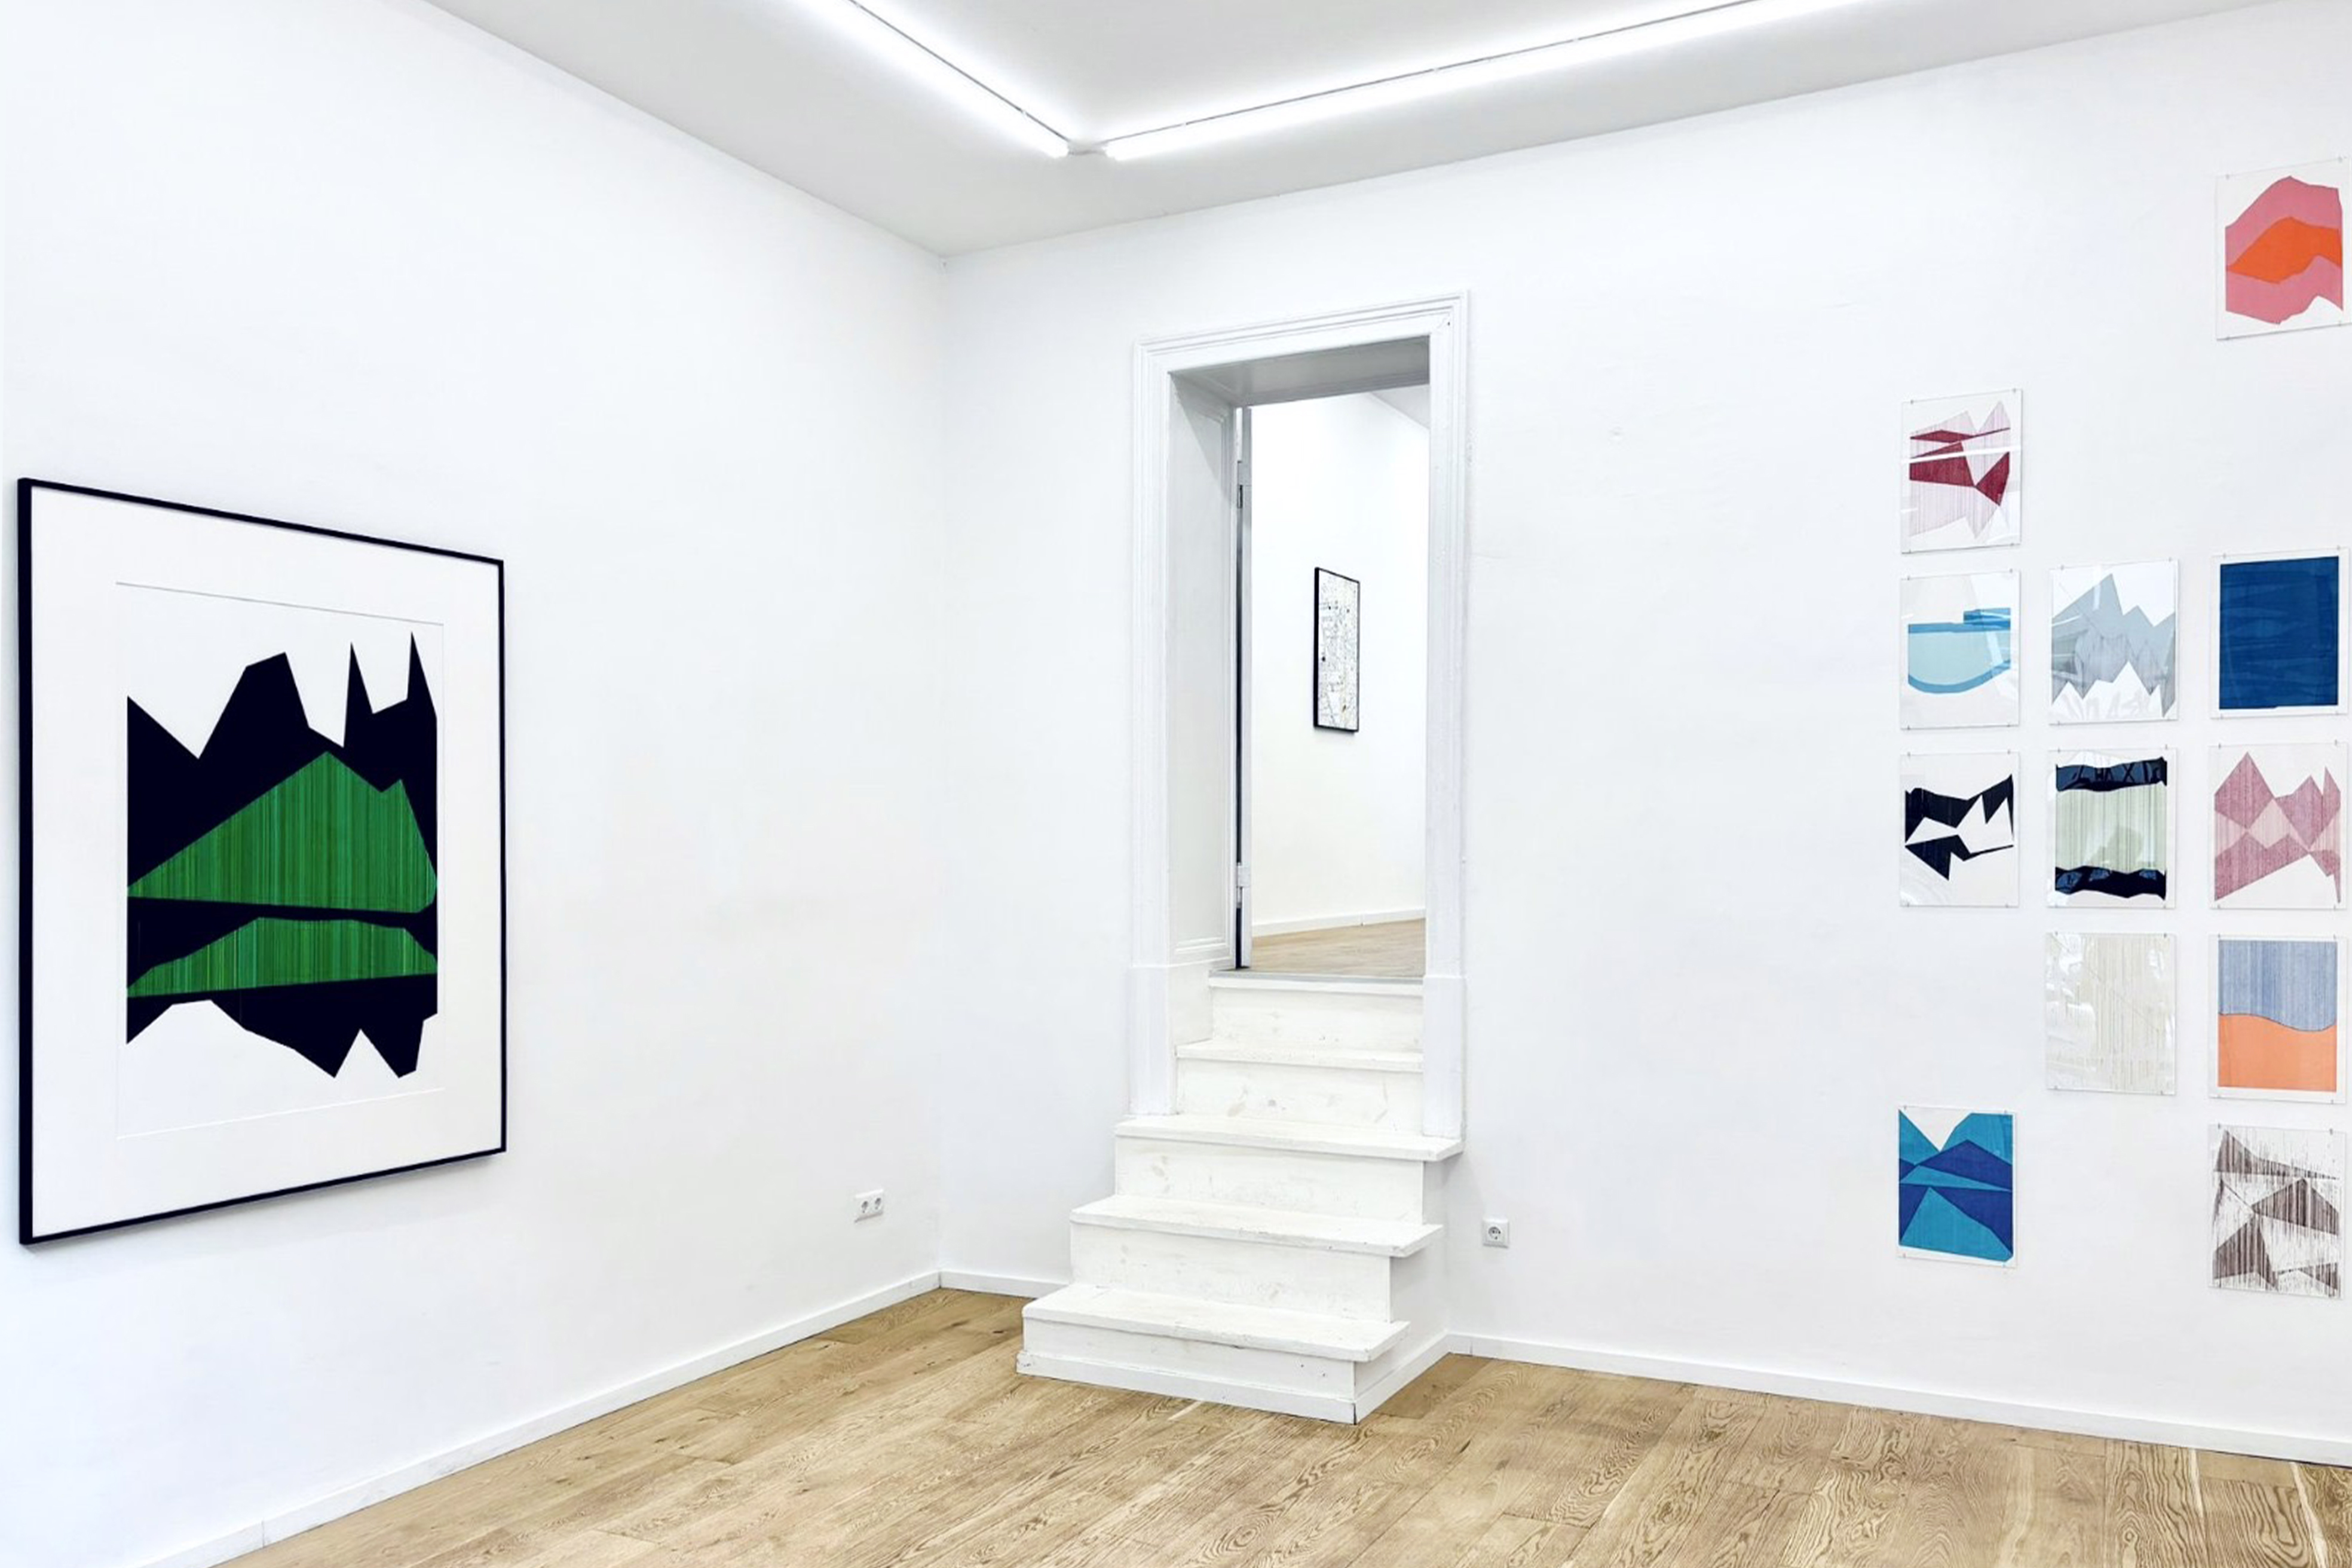
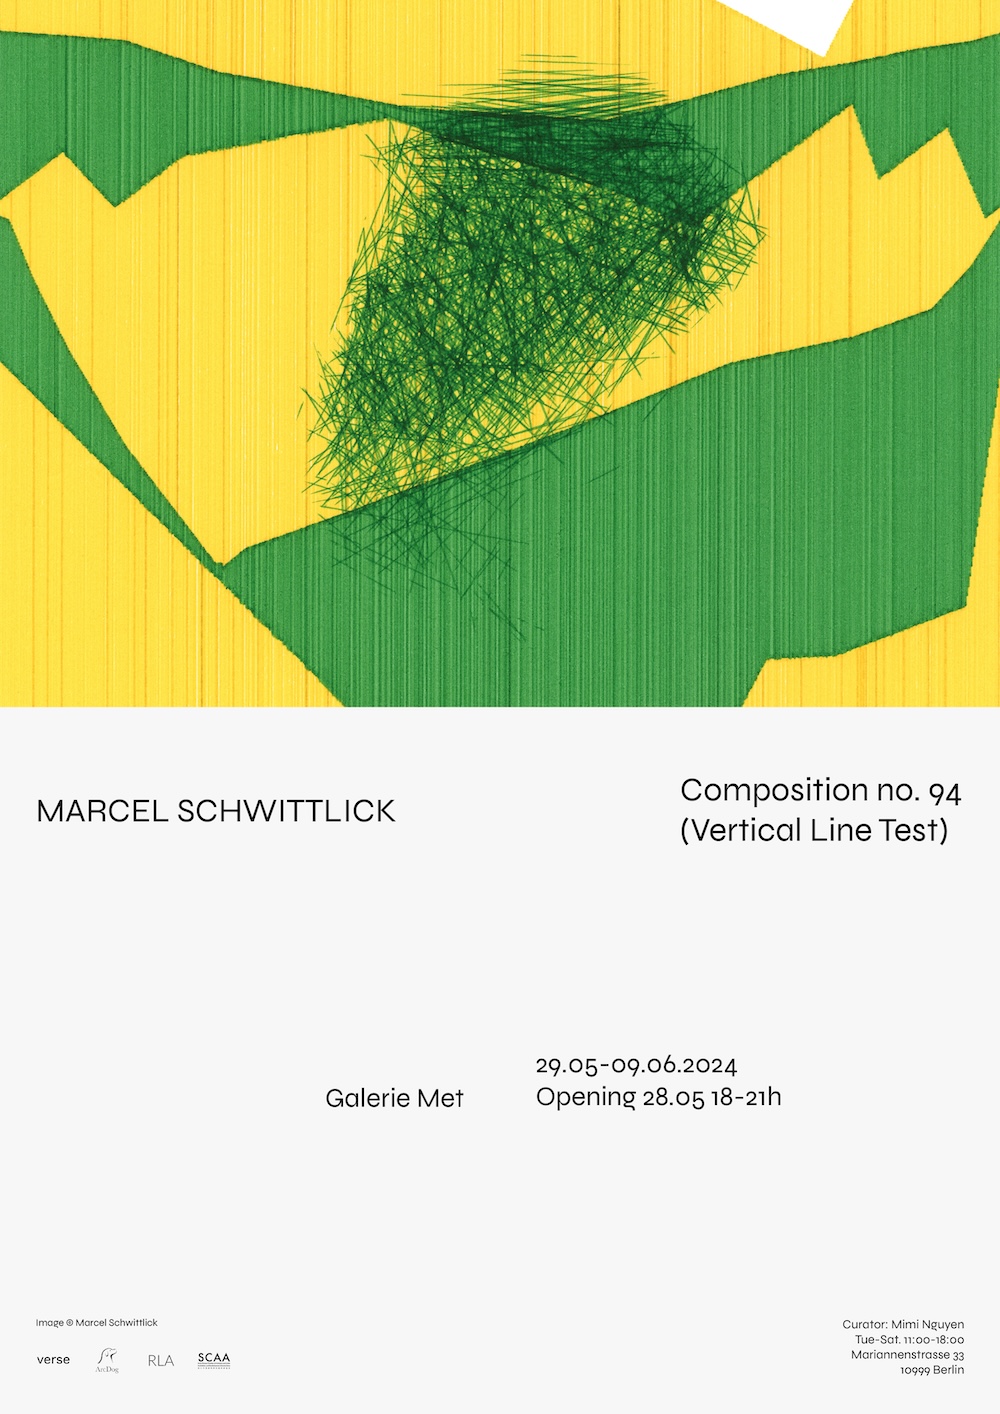
Solo exhibition at Gallery Met
Marcel Schwittlick - Vertical Line Test (Composition no.94)
Gallery Met, Mariannenstraße 33, 10999 Berlin
29.05. - 09.06.2024
Opening 28.05.2024
Curator: Mimi Nguyen
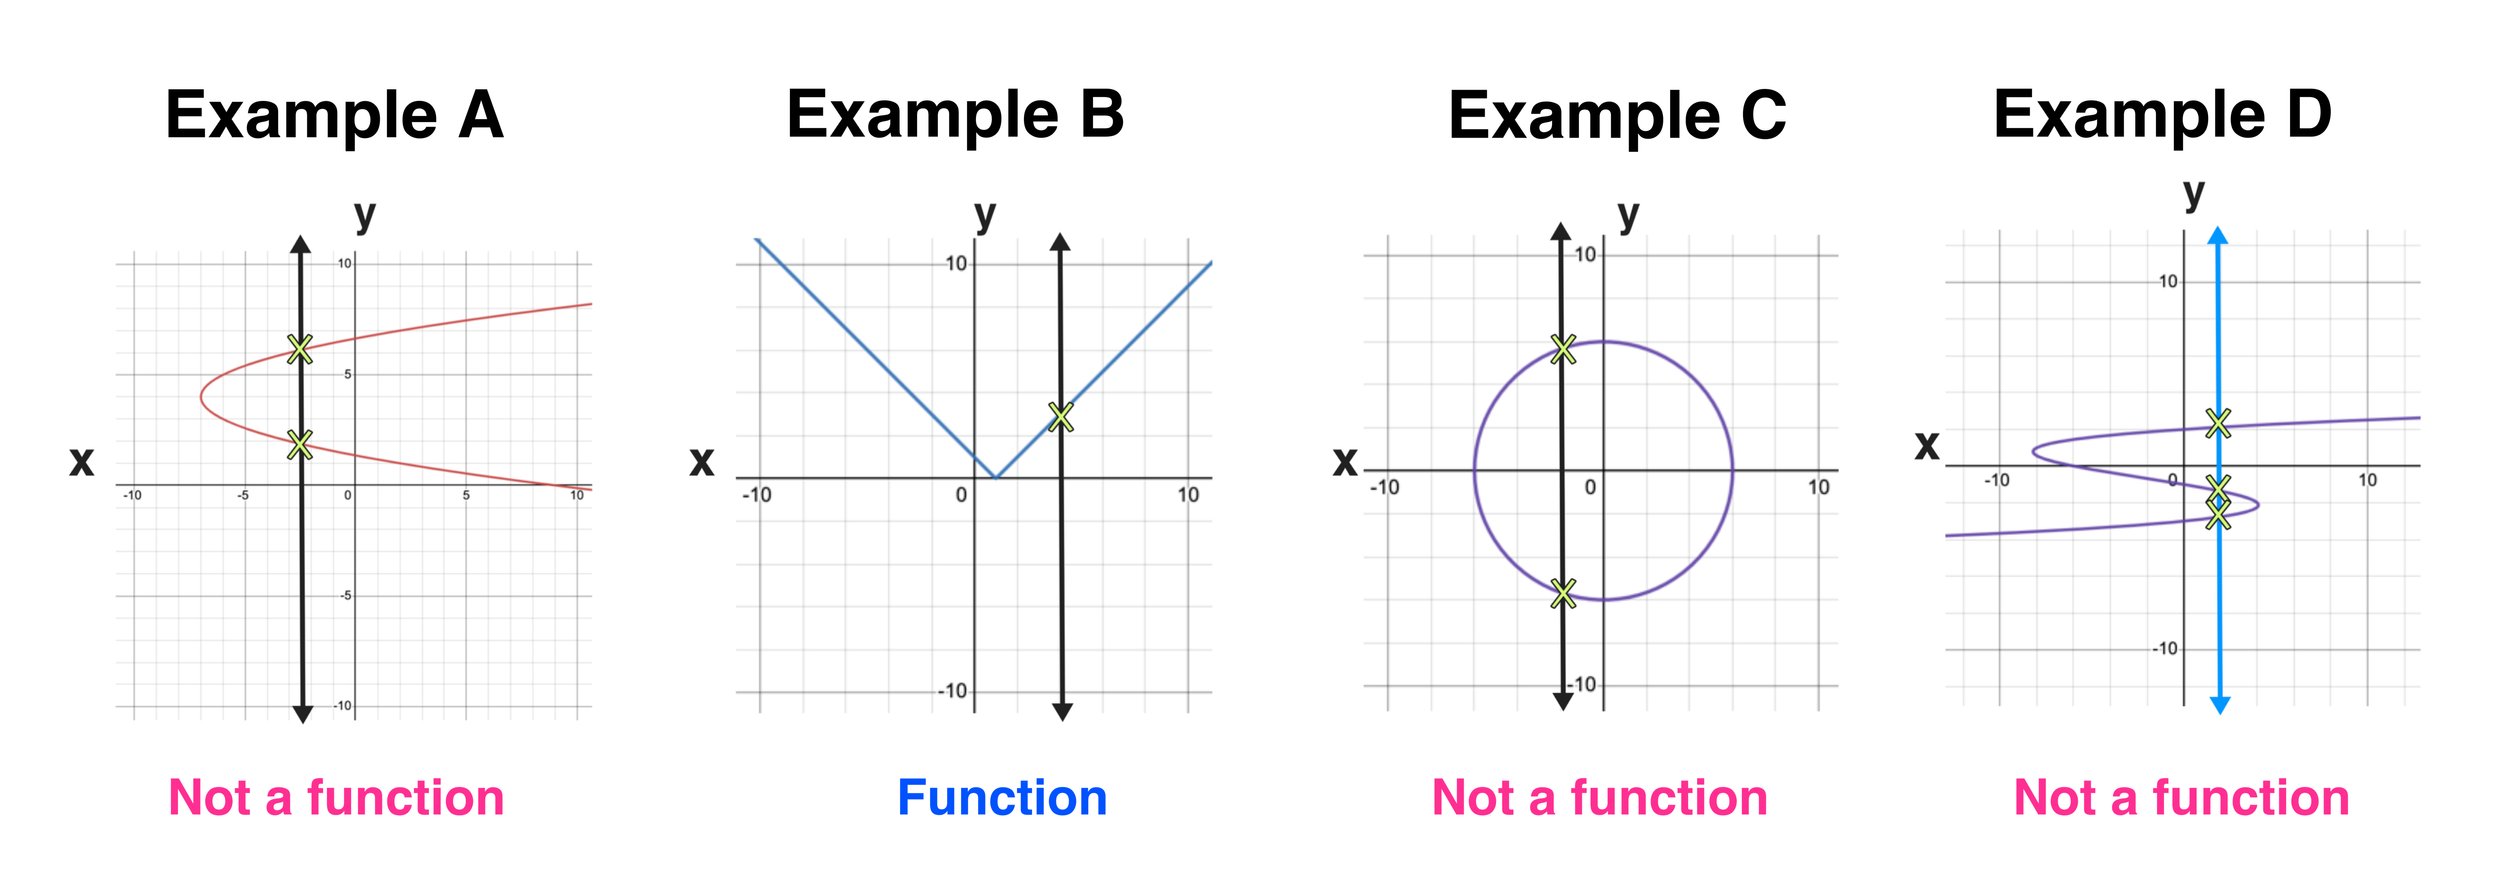
A function can only have one output, y, for each unique input, x.
56d78b36 a0
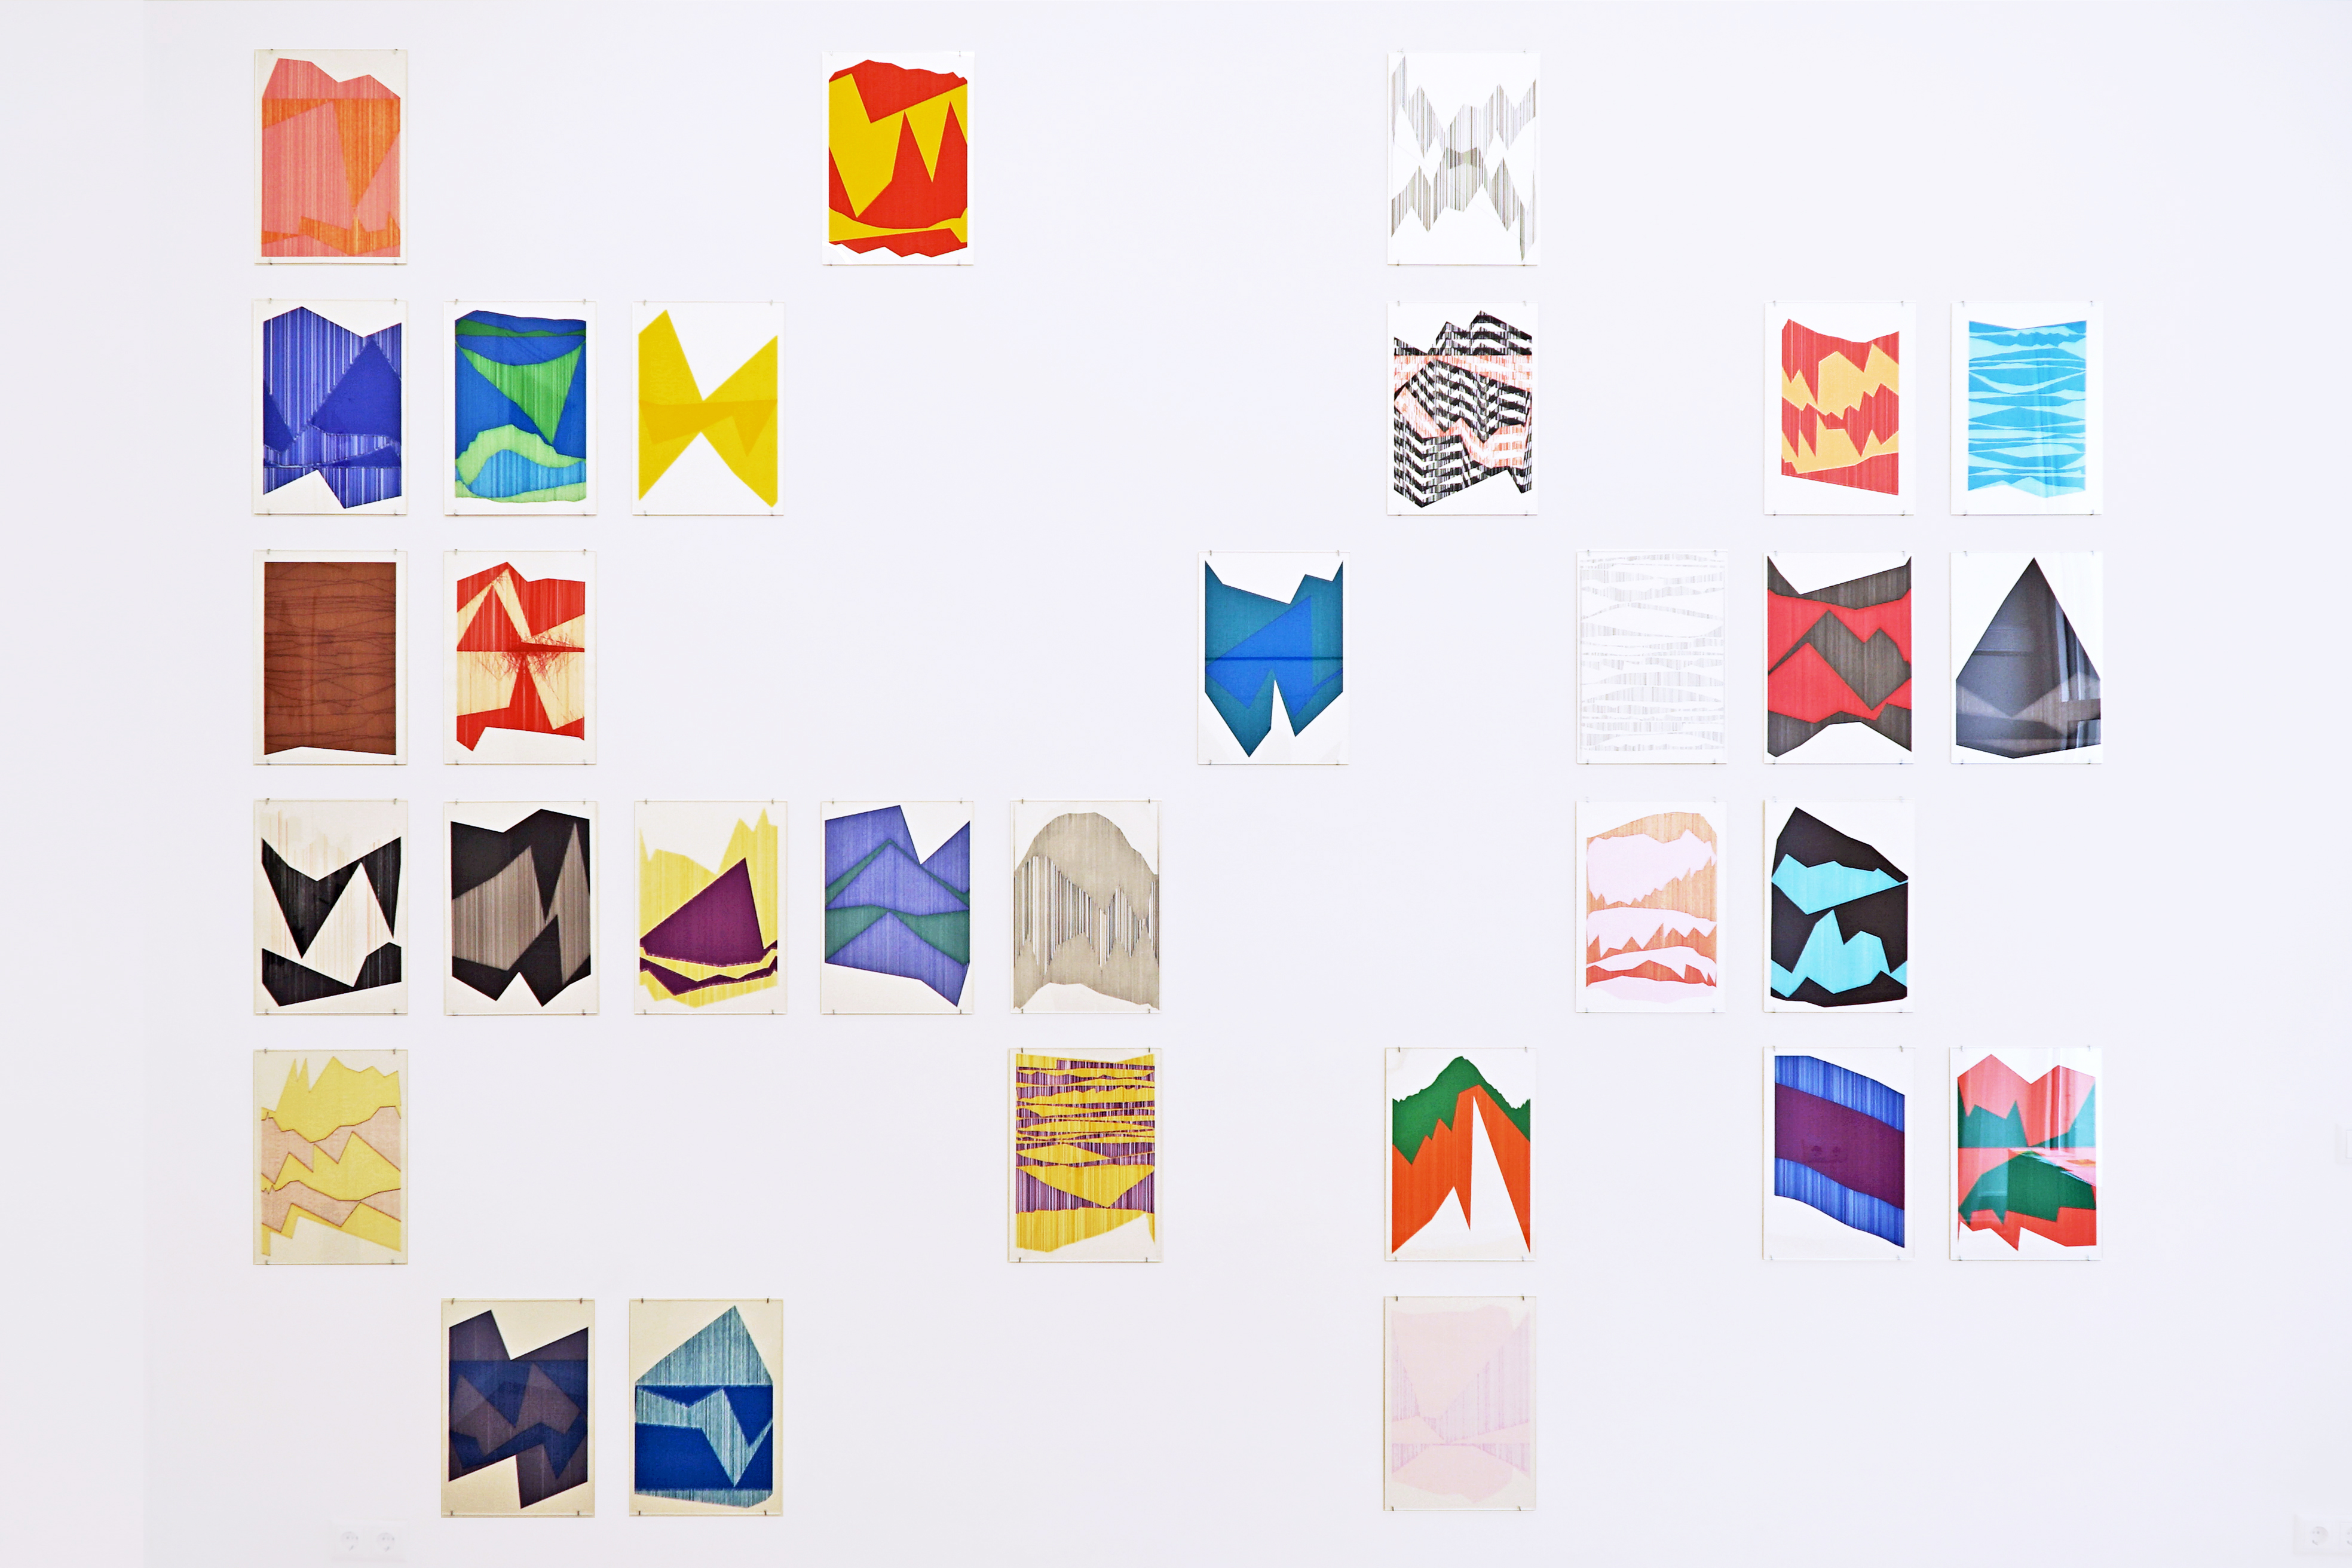
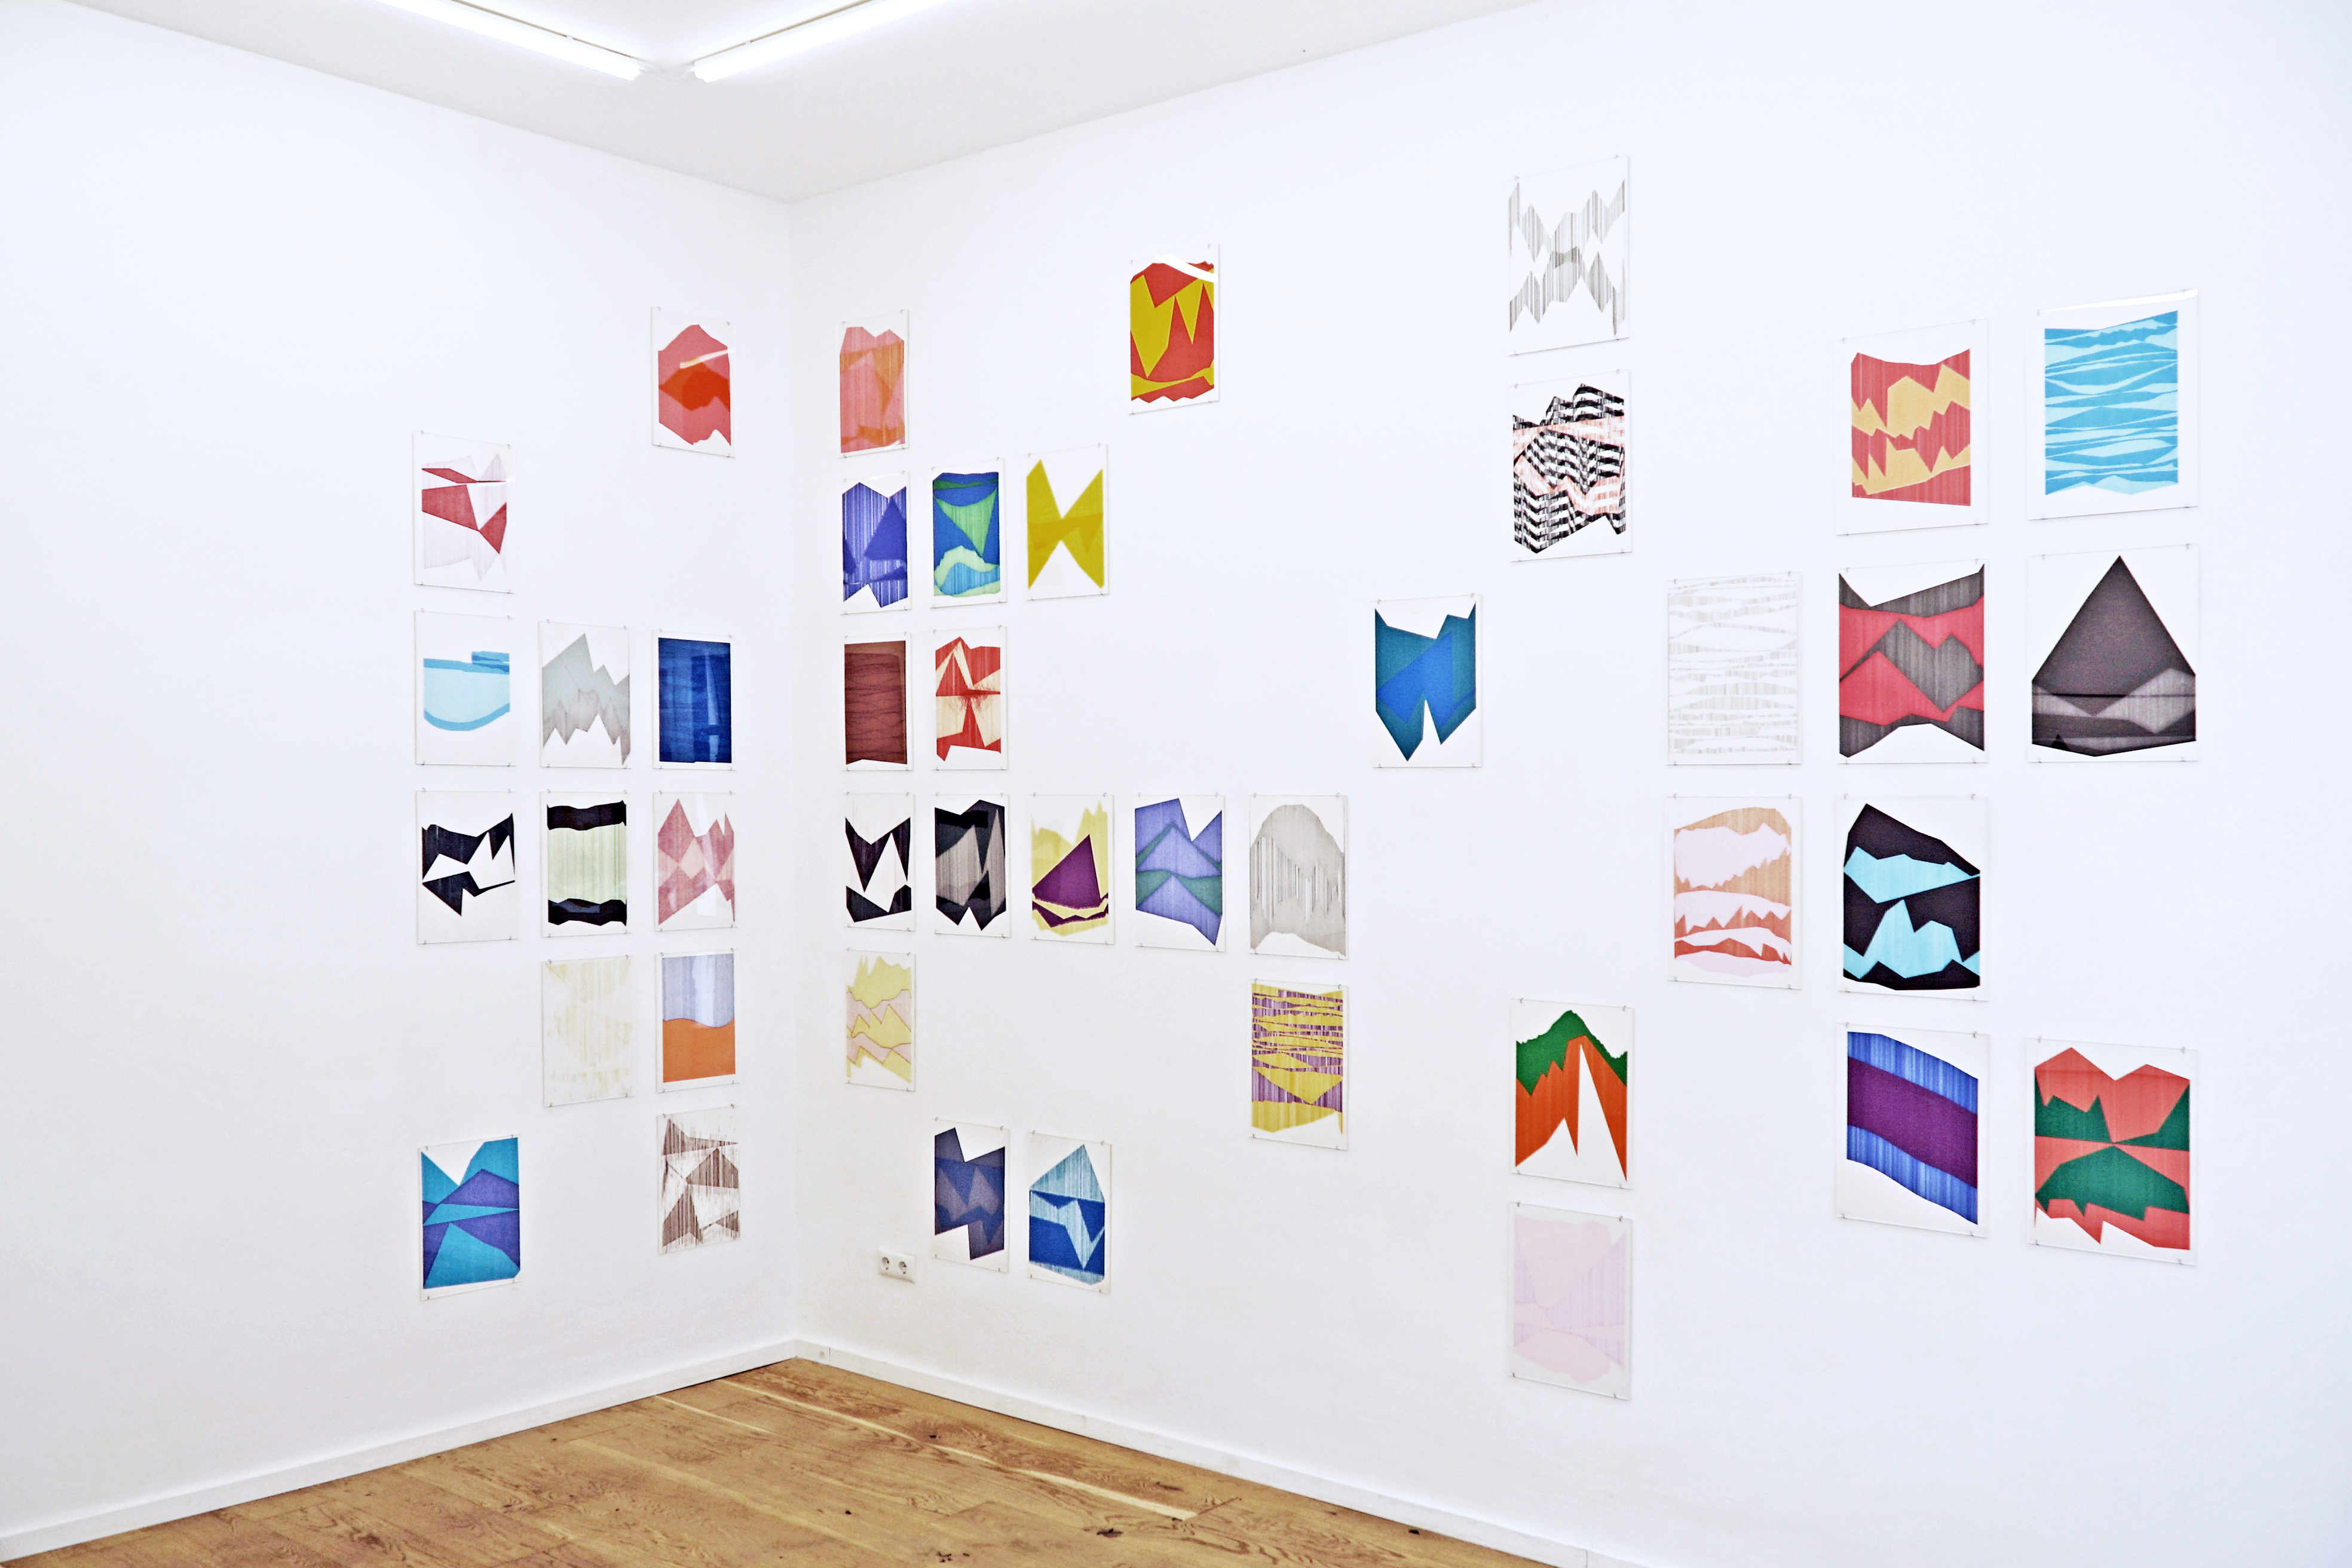
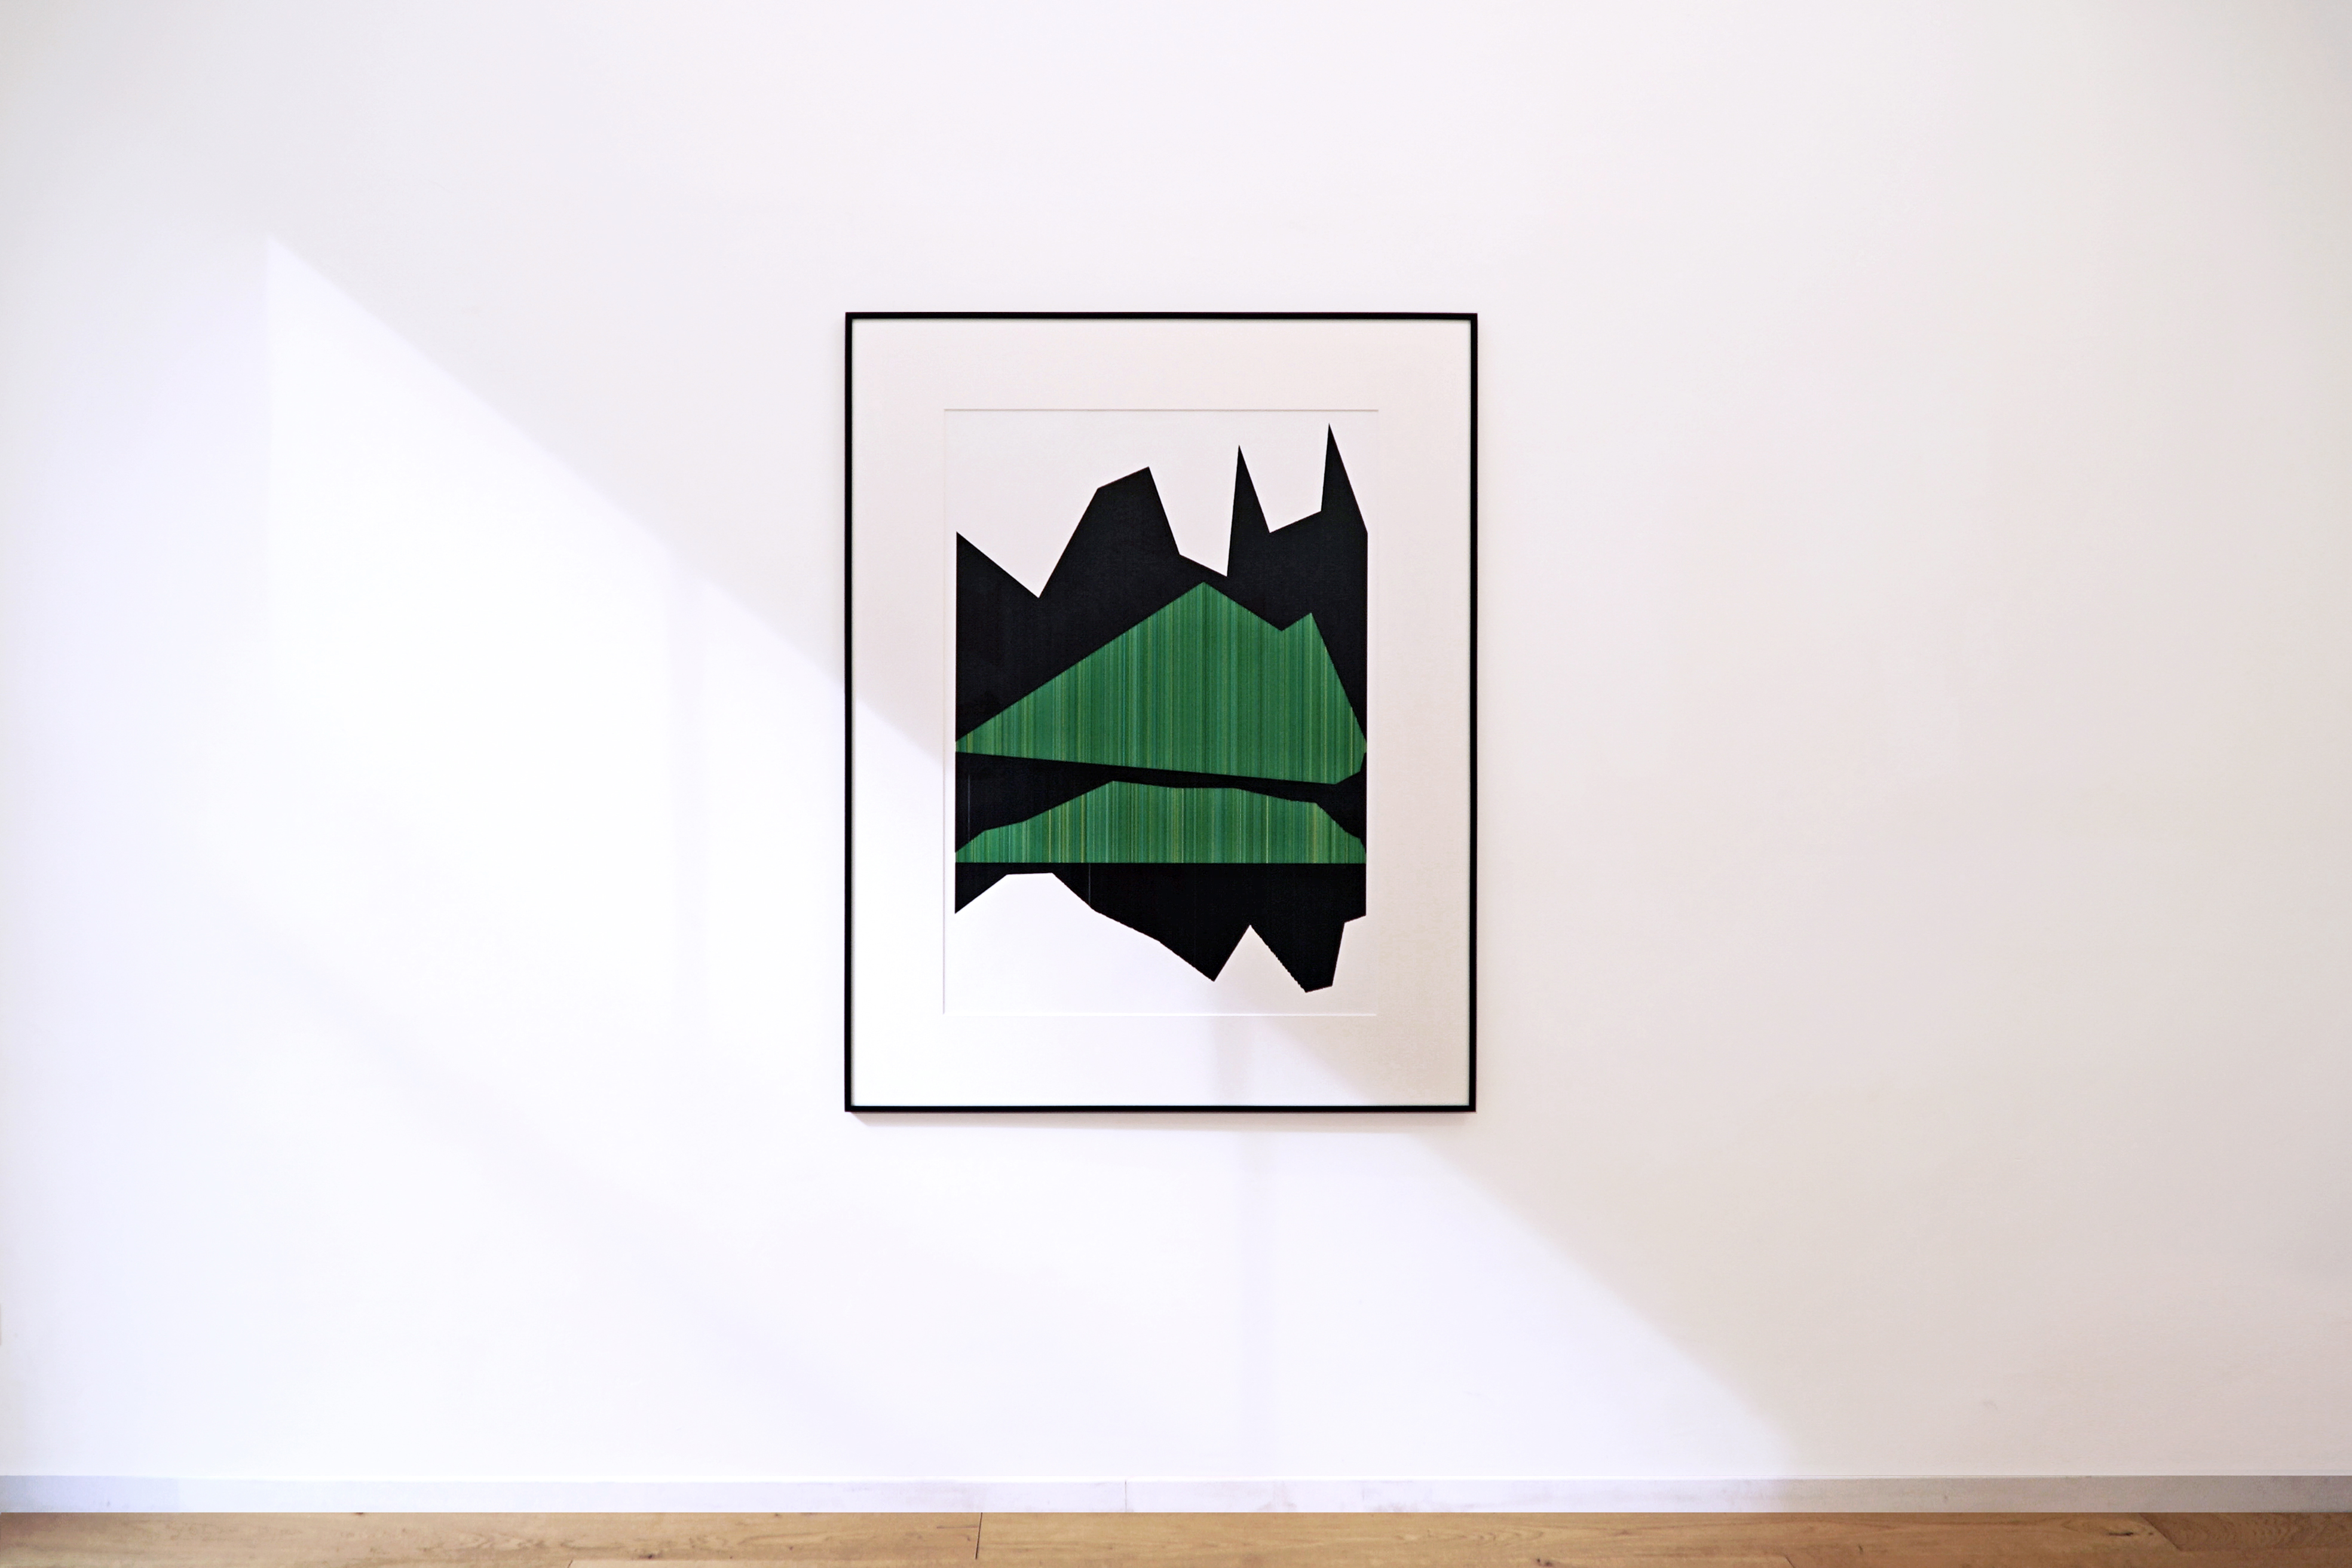
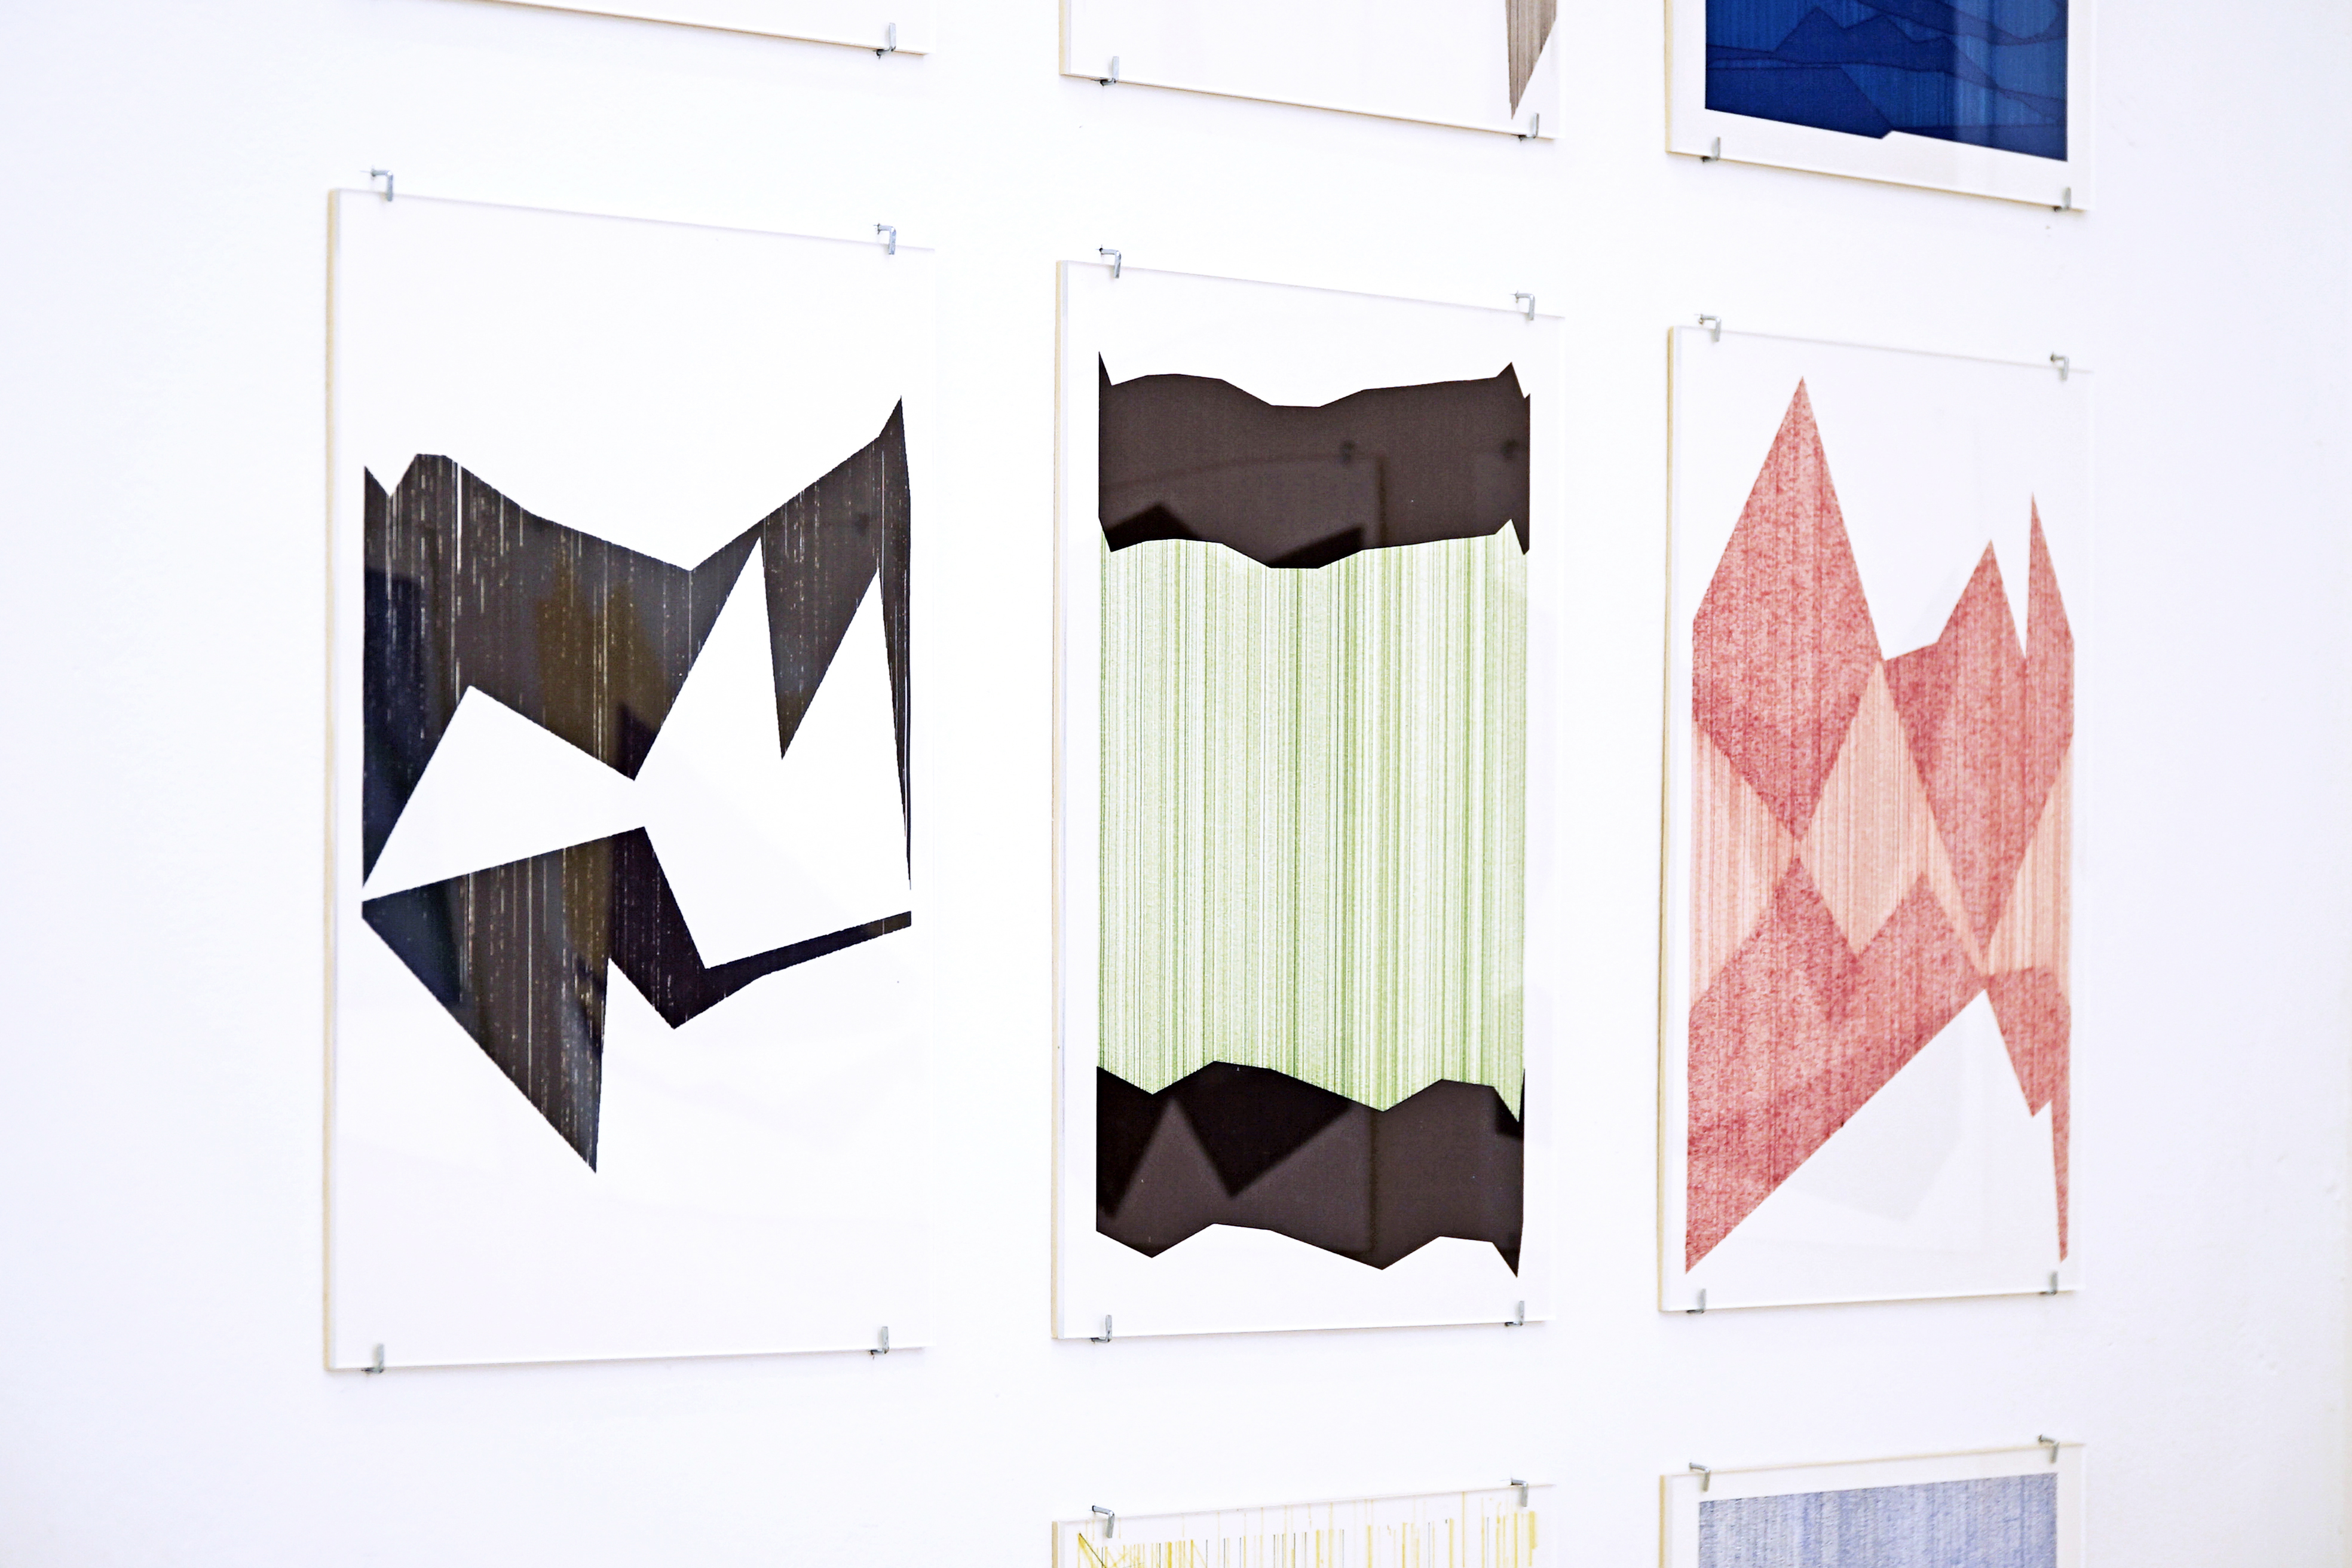
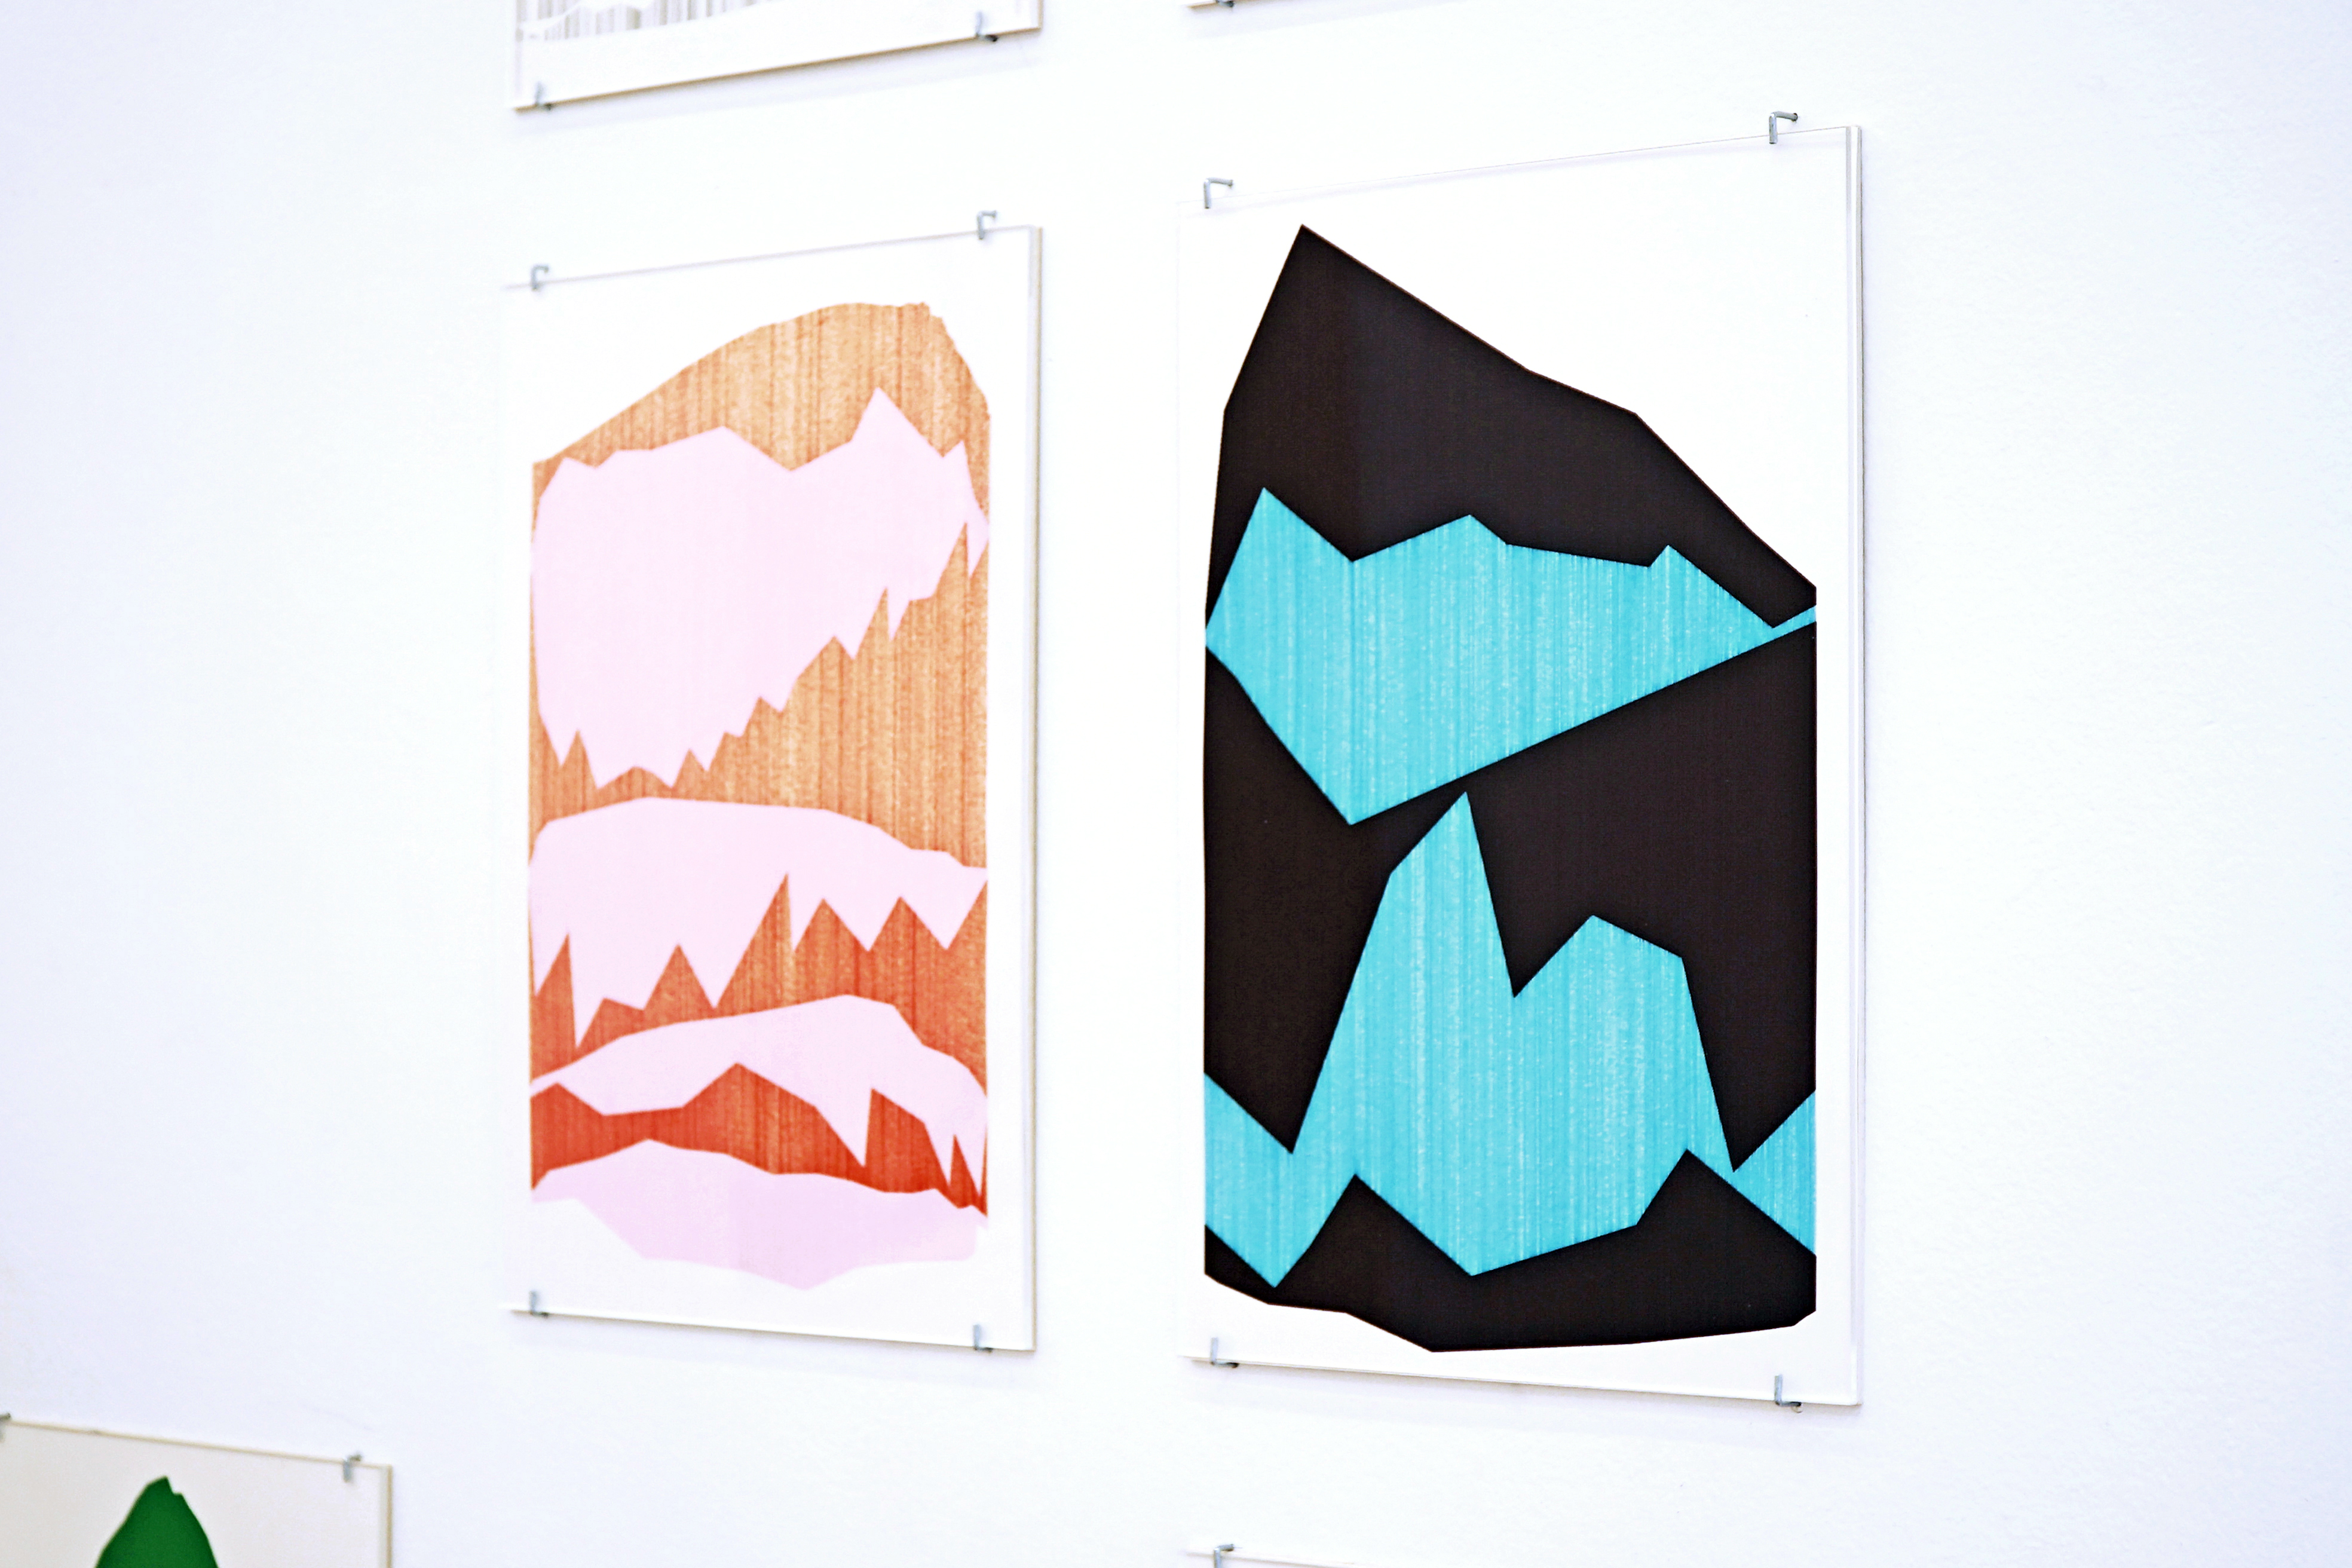
The above images are scans of the original plotter drawings. Just left-click the image for a
full-res 600dpi scan. This series encompasses works in different sizes: A4, A3, A2, A1 and A0.
A4 210x297mm/8.27x11.69in
A3 297x420mm/11.69x16.53in
A2 420x594mm/16.5x23.4in
A1 594x841mm/23.4x33.1in
A0 841x1189mm/33.1x46.8in
Behind the scenes
Inks / Colors / Materials
Various media have been used: Alcohol based copic inks, original 80s water-based felt-tip pens, newly produced water-based plotter pens, solid pigment inks, graphite (pencil), ballpoint pens
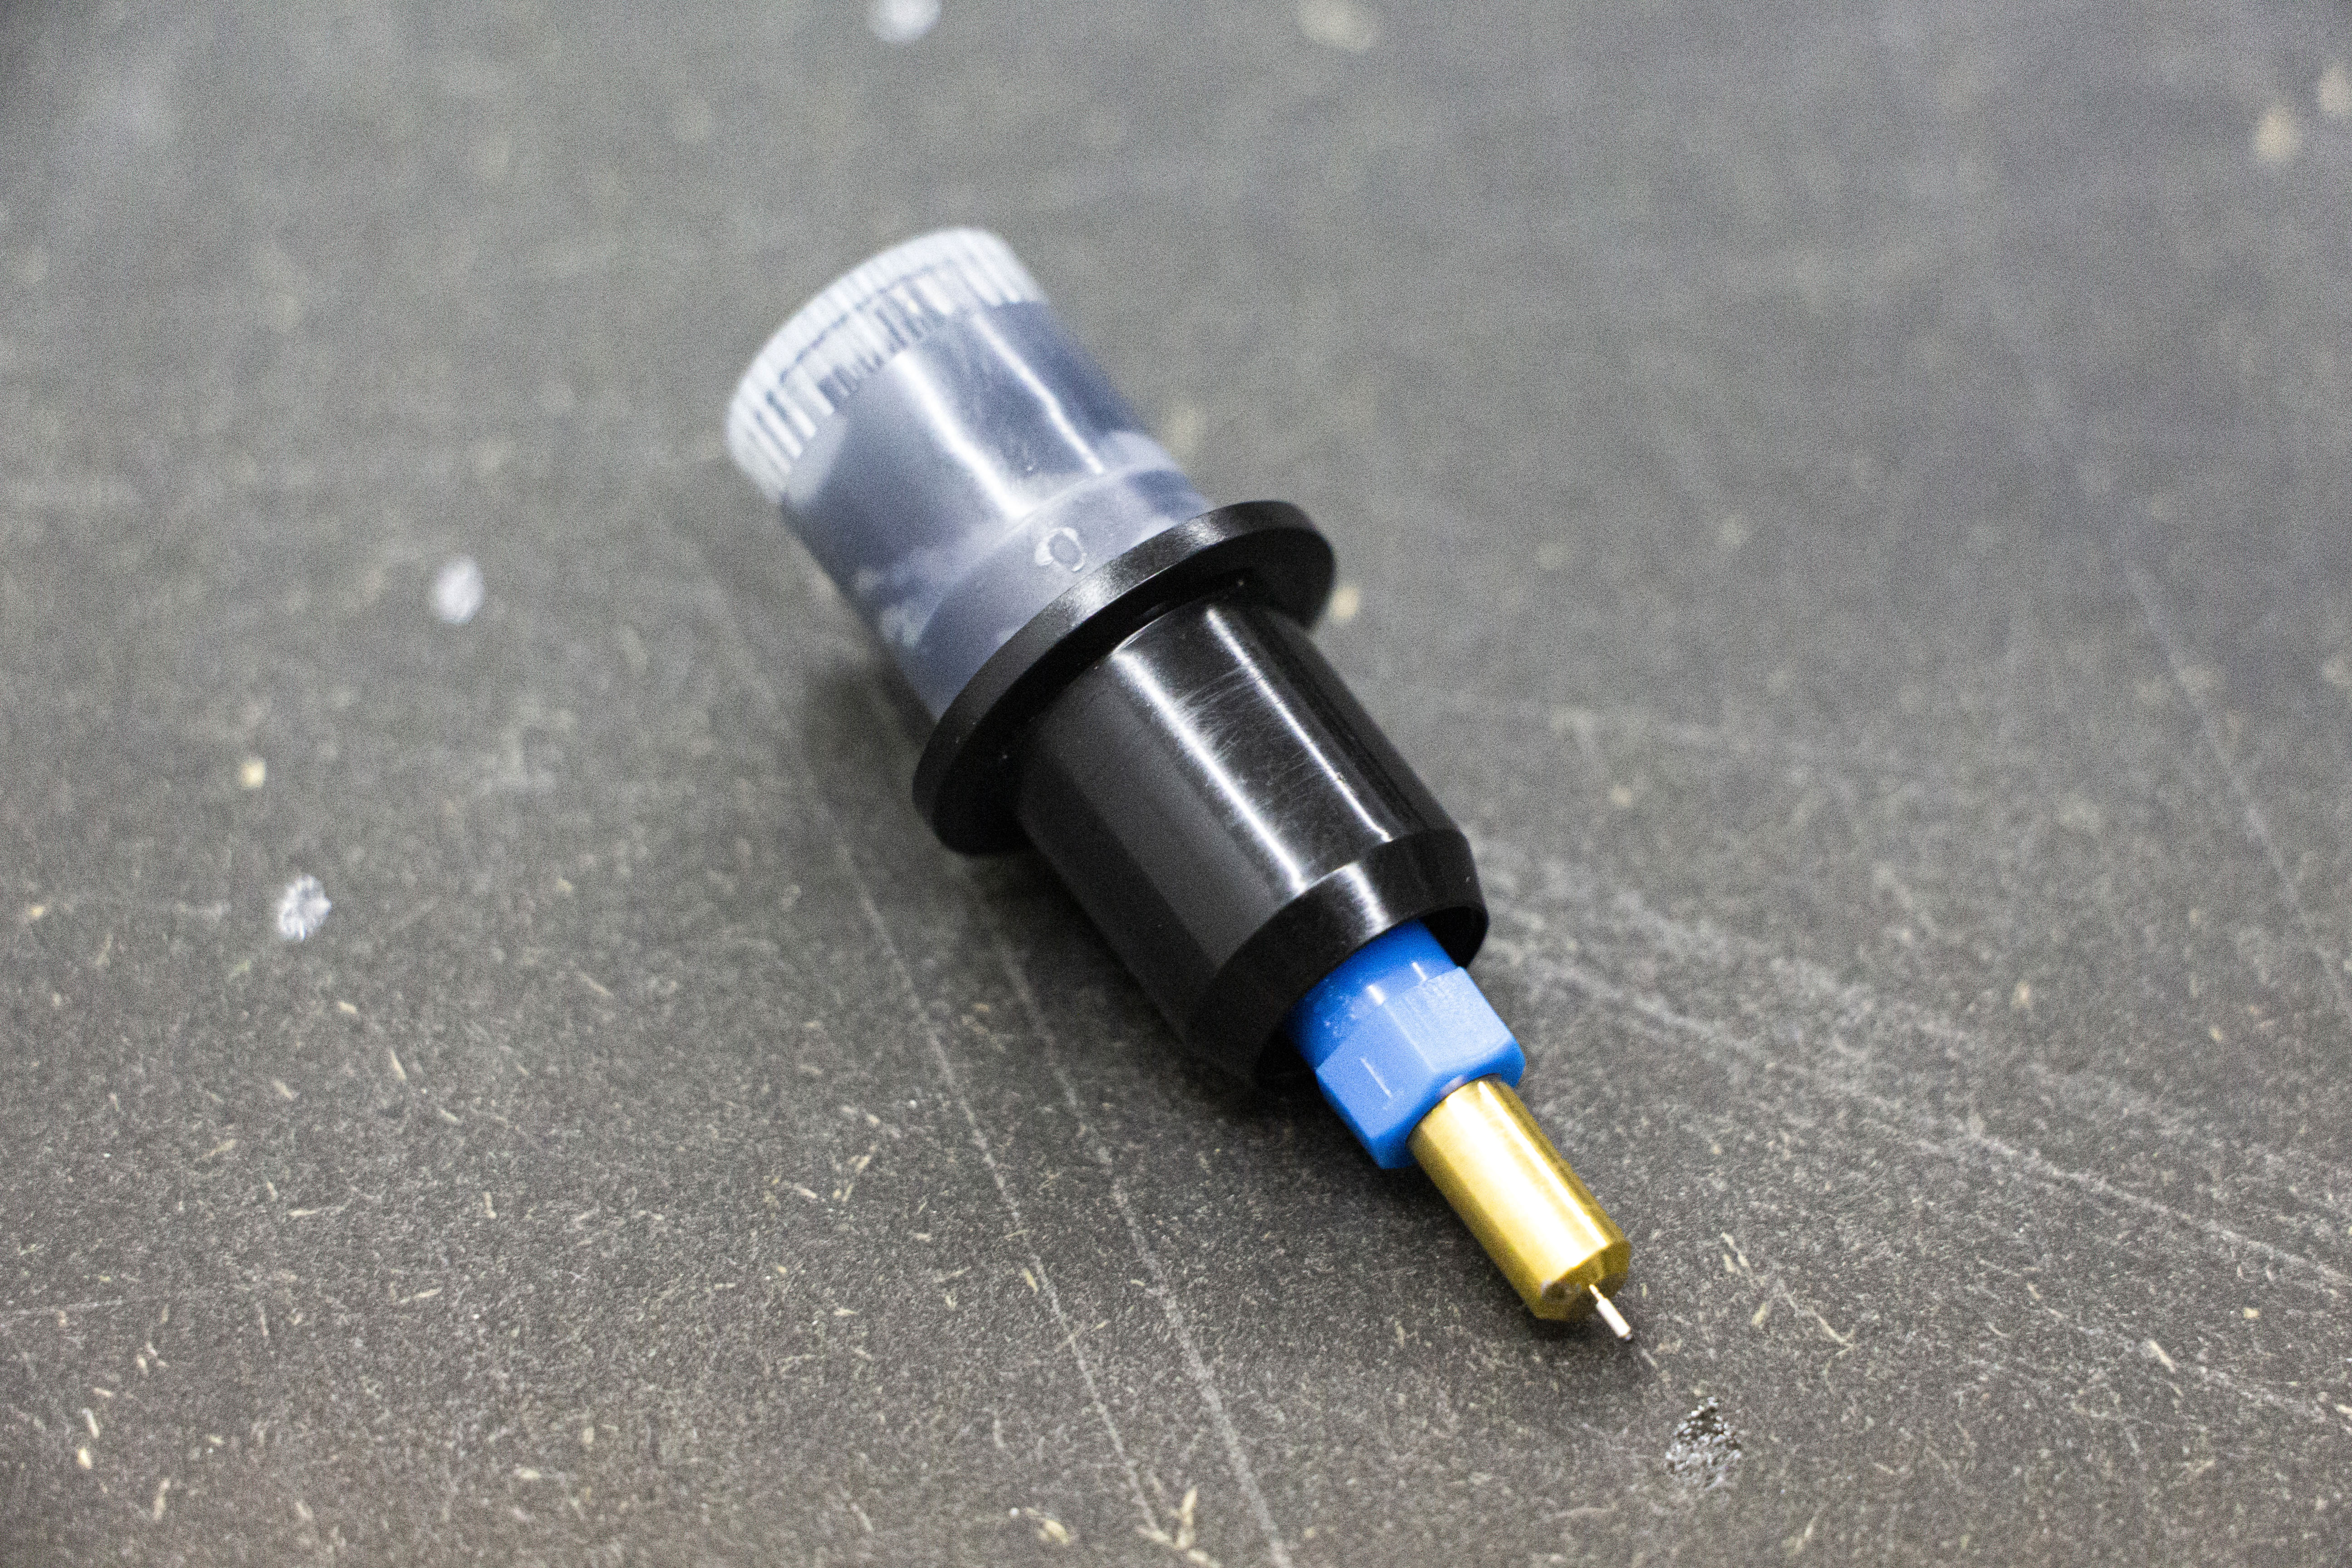
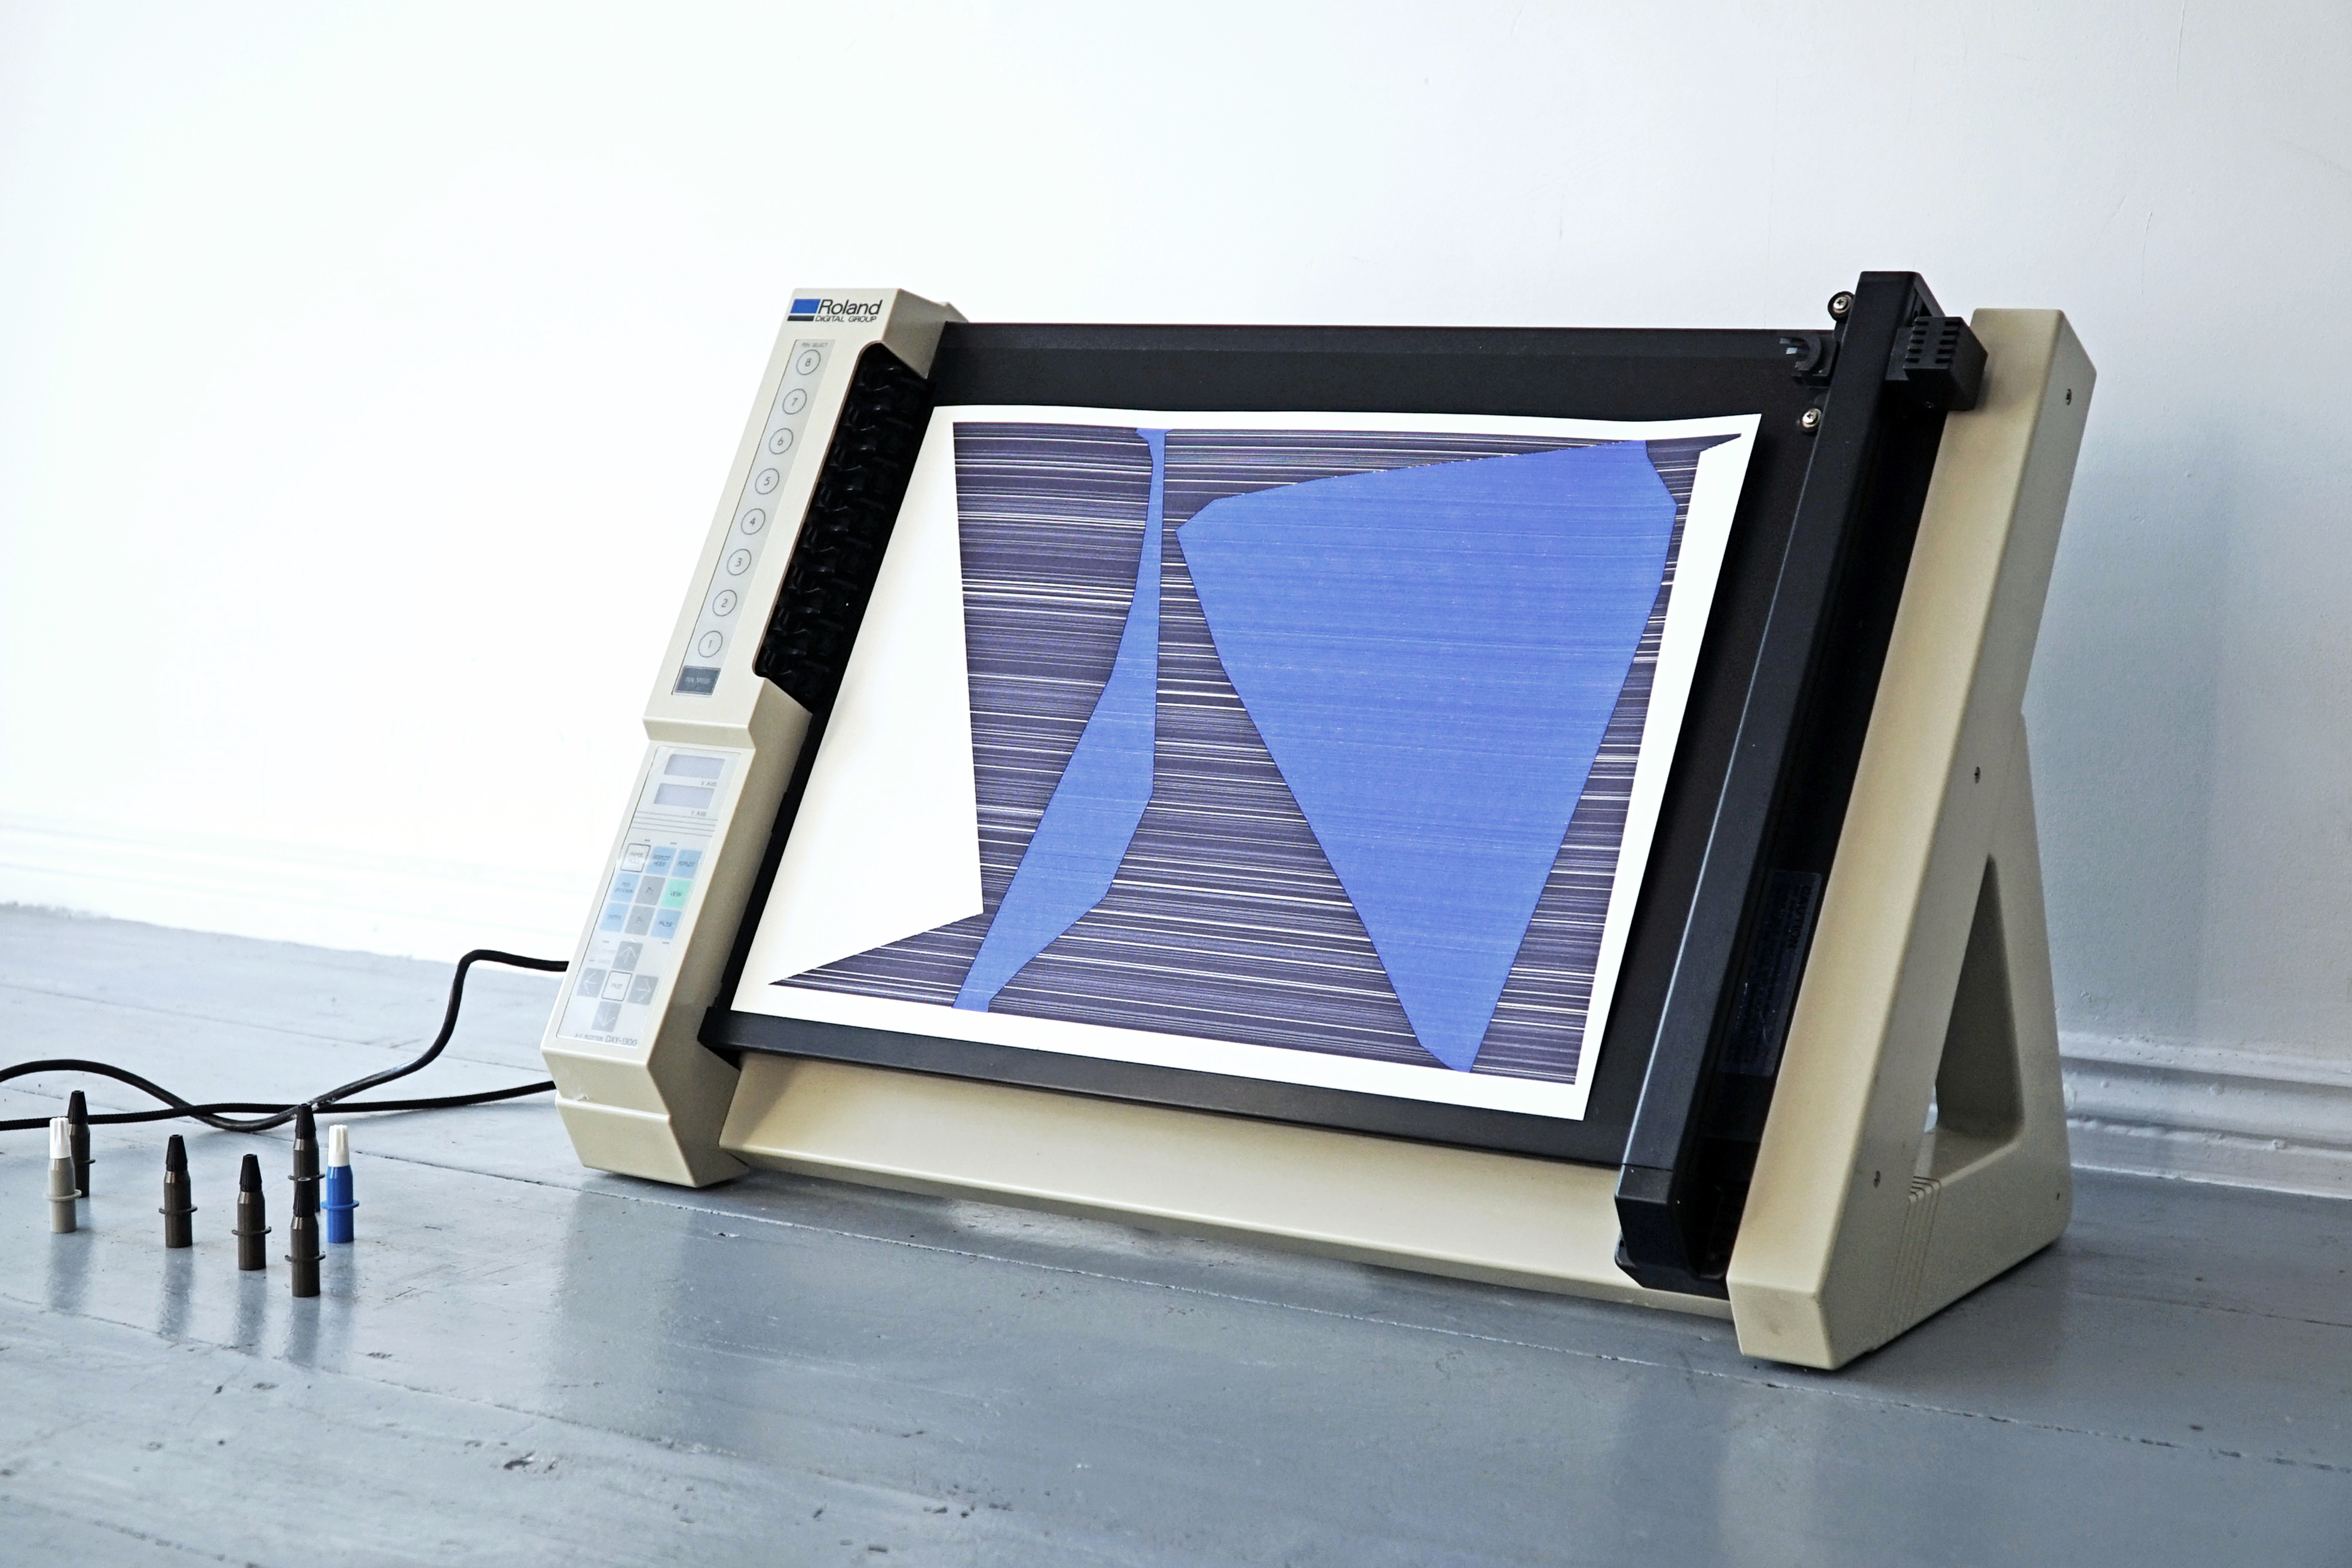
Plotter pen with ink tank
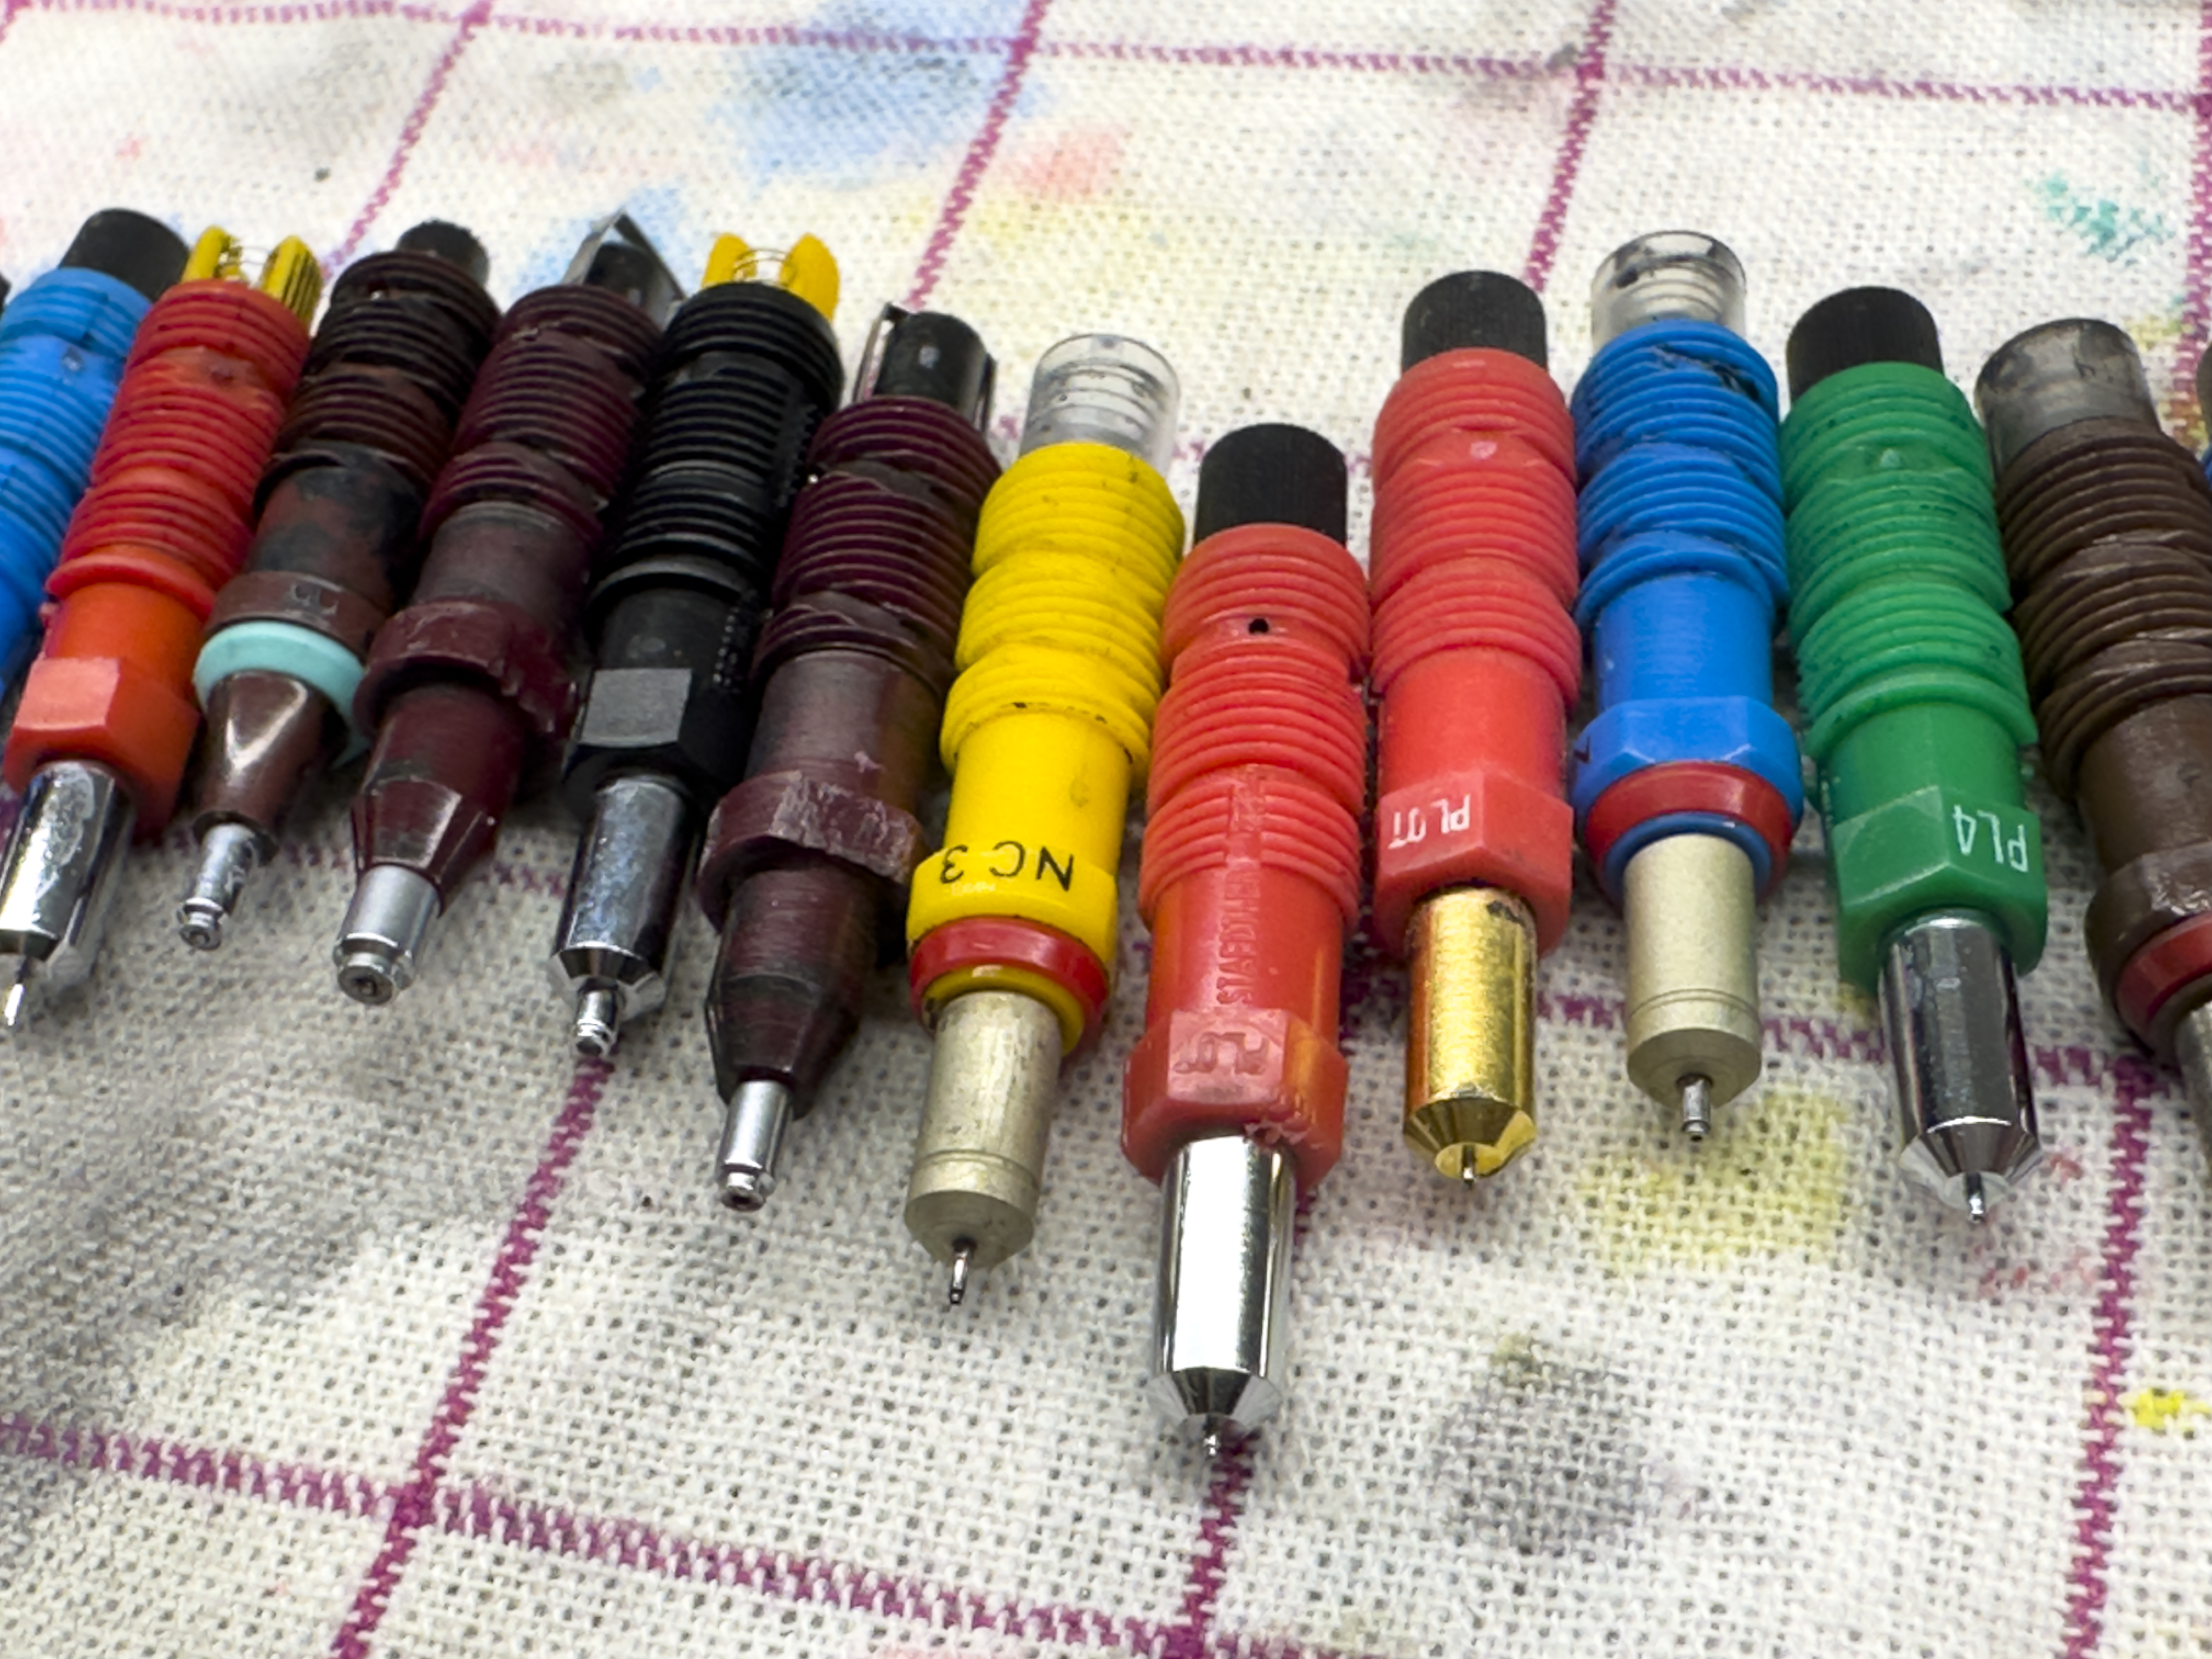
Koh-I-Noor Rapidograph technical plotter pen nibs

Vintage solid pigment archival inks for rapidoplot technical plotter pens
Vintage solid pigment archival inks for rapidoplot technical plotter pens
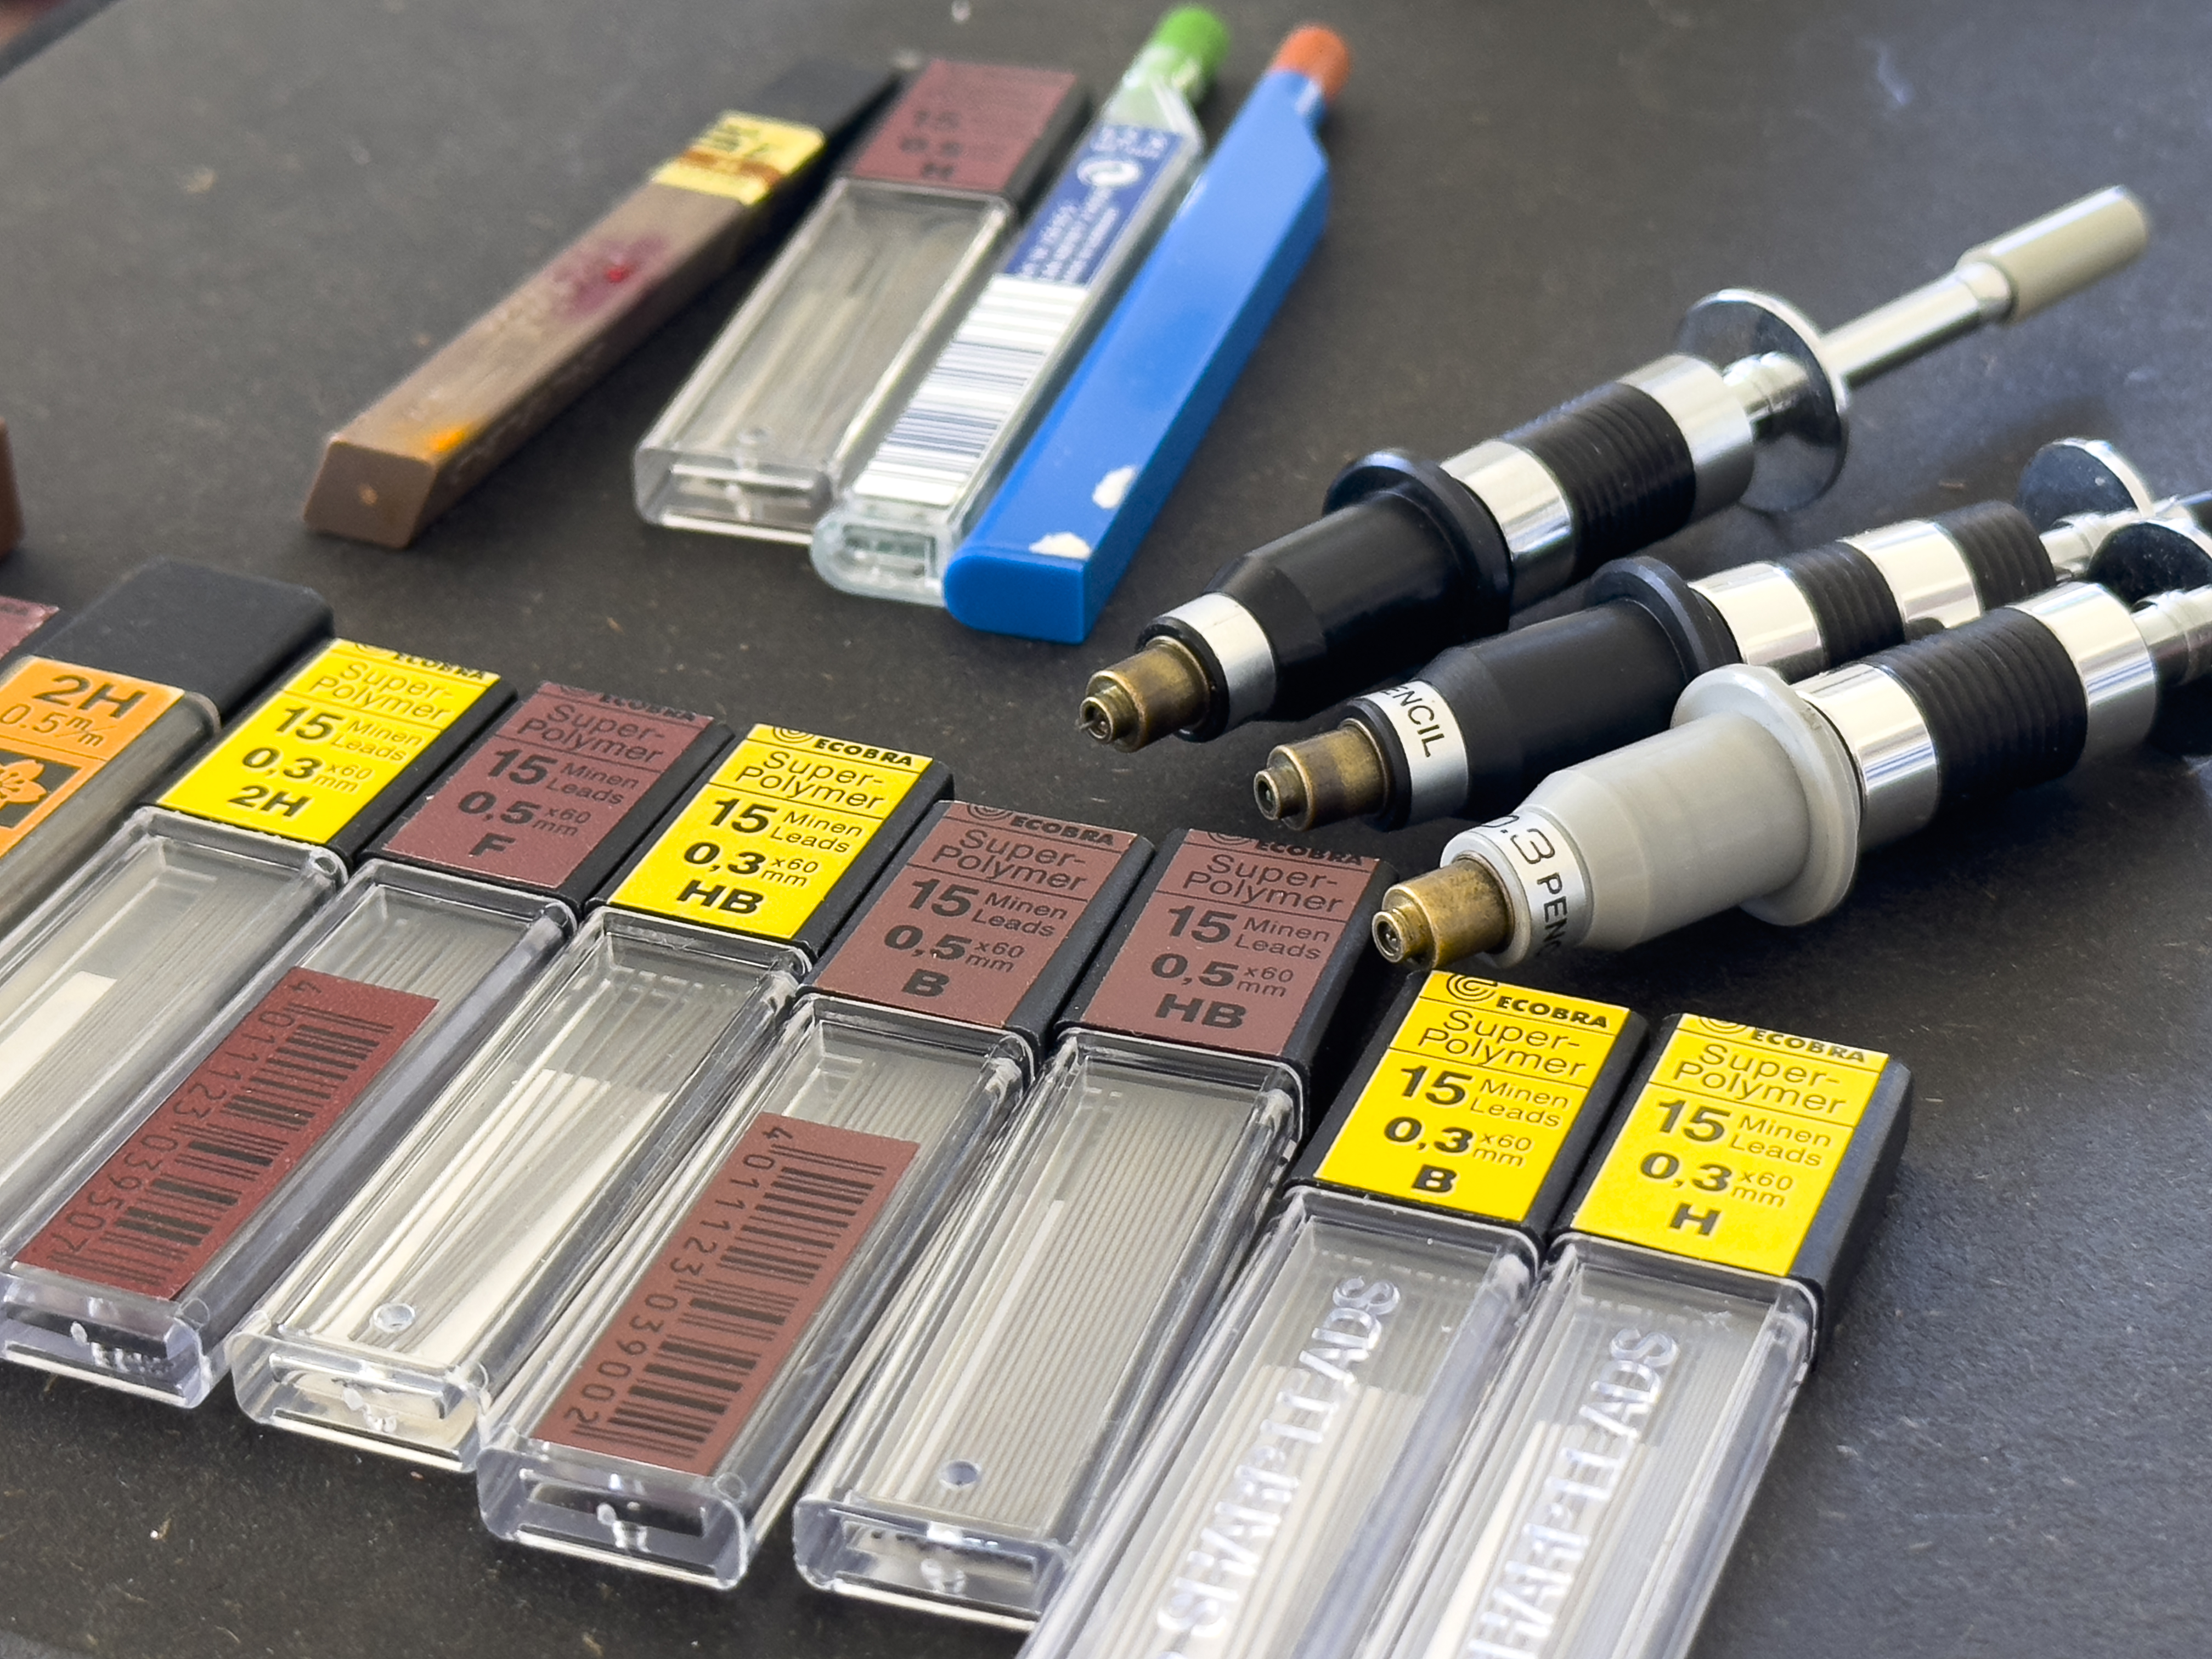
Plotter pen adapters for polymer leads used with a Mutoh XP-500 plotter
Alcohol-based copic inks (in recycled bodies of 80s plotter pens)
Ballpoint pen adapters for HP DraftMaster plotters
testing sheet
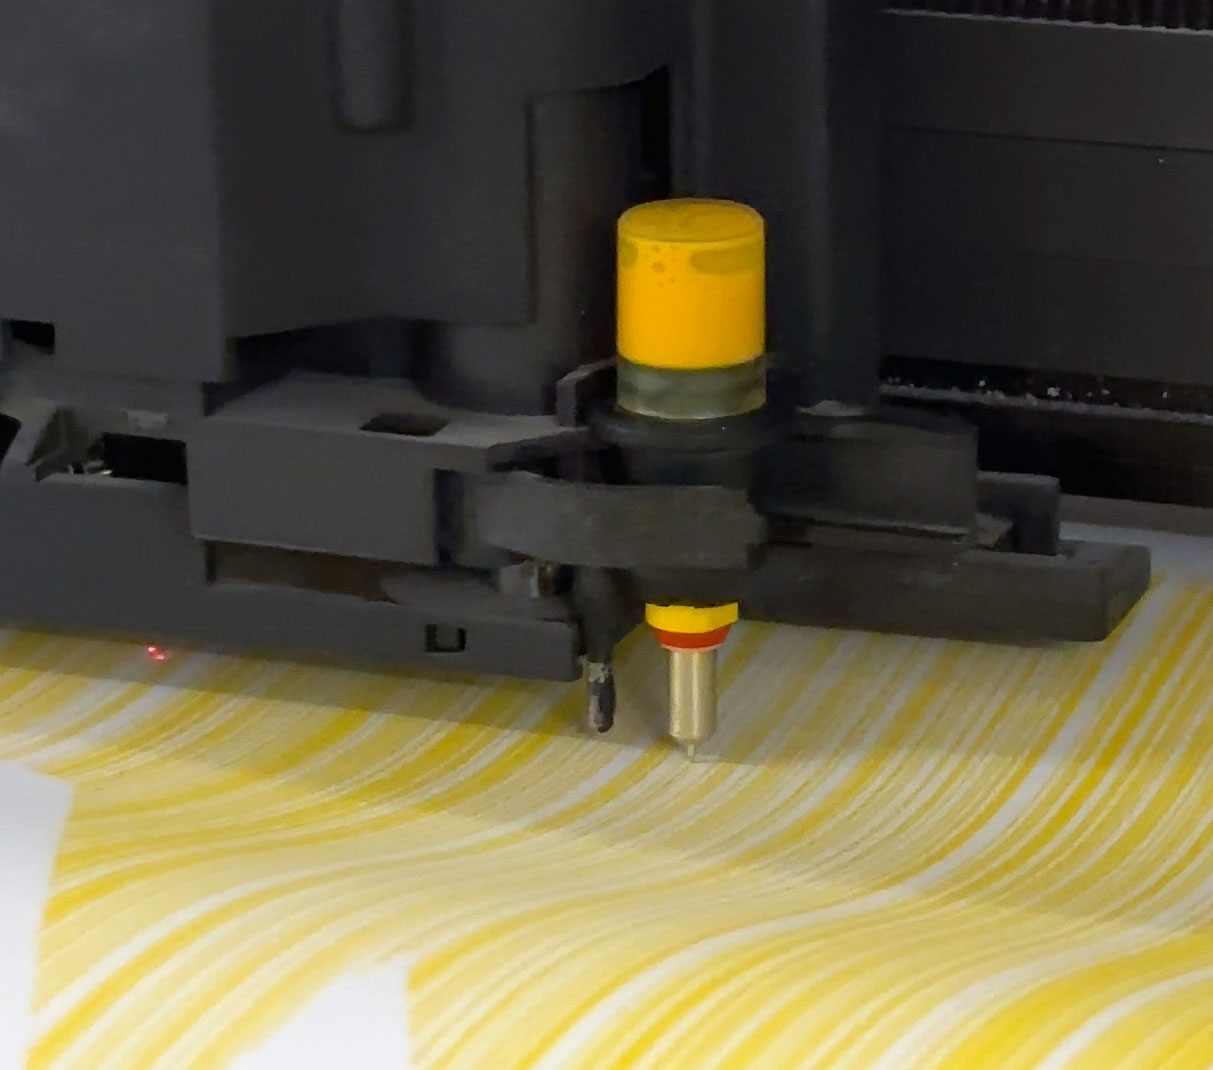
Plotters
The series comes in various sizes, A4, A3, A2, A1 and A0. Various plotters have been used for various sizes: HP 7470A, HP 7550A/B, HP DraftMaster SX & RX, Mutoh XP-500, Roland DXY 1200, 990, 980 and Graphtec MP2000
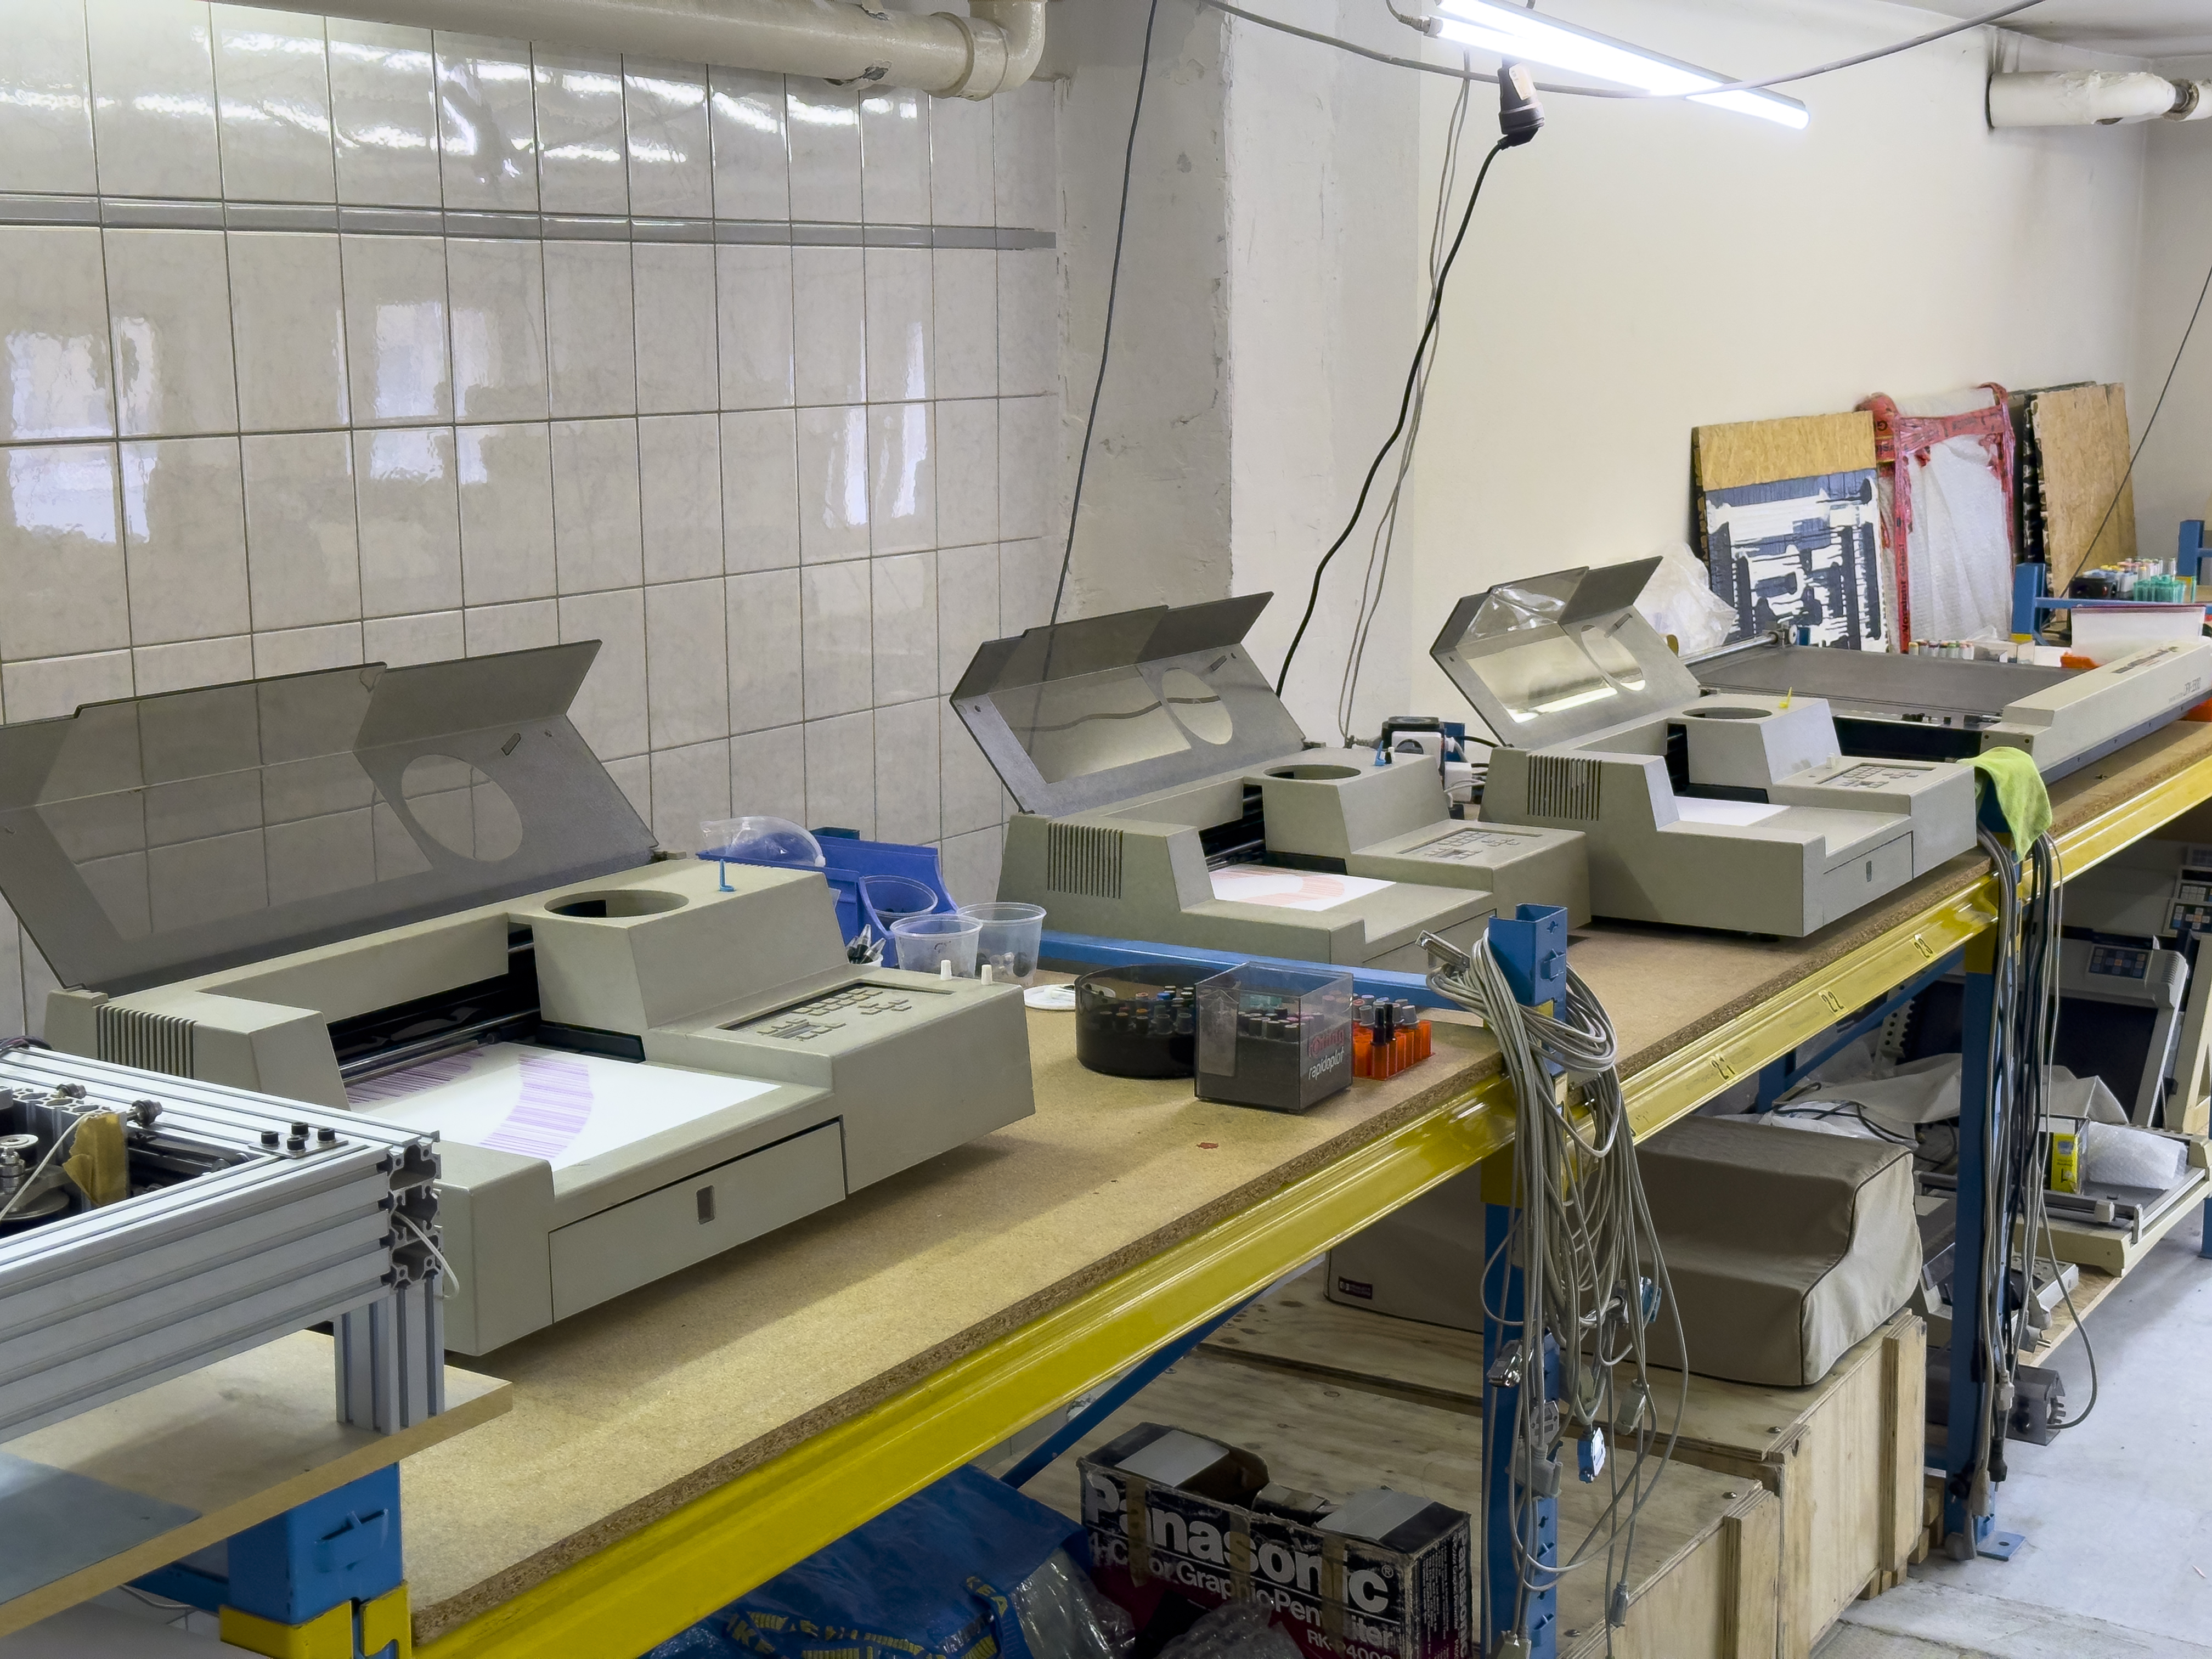
Composition #94 being plotted on various vintage plotters
Videos
Composition #94 (871a37bf) being plotted on a HP DraftMaster SX
Composition #94 being plotted on two HP 7470A
Composition #94 (8f2fb835) being plotted on a Graphtec MP2000
Composition #94 (7f11fcfb) being plotted on a HP 7550
Composition #94 (d3c22d20) being plotted on a HP 7550
Composition #94 (1fe0b596) being plotted on a HP 7470A
Composition #94 (56d78b36) being plotted on a HP DraftMaster SX
Math
The "functional" property of a polyline in a mathematical or geometrical context refers to a condition
where, for any given value of x within the polyline's domain, there is exactly one corresponding
value of y. This means that at any x-position along the horizontal axis, the polyline does not
intersect itself vertically, ensuring that there's only one y value for each x. Such a polyline behaves
similarly to a mathematical function in this aspect, where each input (or x value) maps to a single output
(or y value).
In practice, this means the polyline can be composed of multiple straight line segments connected end to
end, but none of these segments can overlap vertically when projected onto the x-axis. This ensures the
polyline passes the "vertical line test," a visual check used to determine if a curve represents a function.
If you can draw a vertical line at any position along the x-axis and it only intersects the polyline at one
point, then the polyline satisfies the functional
property.
Parameter space


3-6 points per line, random section count


6-10 points per line, random section count


3 sections 6 points


3 sections 12 points


5 sections 12 points


7 sections 2-10 points


6 sections 10-30 points


9 sections 2-10 points


22 sections 2-50 points
Inspiration
Vera Molnar's oeuvre has been a touchstone in my artistic evolution, seamlessly weaving into
my style and
perception, often beyond my conscious choice. Her enduring presence in the generative art world has not only
shaped the genre but also profoundly influenced my approach. I am particularly attuned to her minimalist
exploration of form, especially her nuanced use of lines. The understated transformations and the almost
imperceptible shifts in her work have fascinated me from my earliest acquaintance with her art.
Her methodical explorations, characterized by simplicity and subtle variation, continue to be a wellspring
of inspiration. It's evident that elements of her pioneering work have found echoes in my recent series.
I view this as an homage to hers, where I infuse my distinct perspective by incorporating dynamic lines
as a core element, thereby delving into the interplay between digital possibilities and bodily movement.
This approach is not so much an attempt to replicate her methods but rather a respectful nod to her legacy,
as I explore new frontiers within the framework she has inspired.
Vera Molnar, sankt victoire blues, collage, 50x50cm, 1997
Vera Molnar, horizontalen, acryl/leinwand, 150x150cm, 1972, m734w, FNAC bretagne
Vera Molnar, 8 carrés coupés; Collage; 48x48cm, 2018, DAM Projects, Berlin
Vera Molnar, 8 carrés coupés; Collage; 48x48cm, 2018, DAM Projects, Berlin
Next steps
Approximating a "functional" polyline into an actual mathematical function can be
achieved through various methods, each with its own advantages and suitability for different applications.
Here are some common approaches:
1. Piecewise Linear Functions
The most straightforward approximation is to treat the polyline as a piecewise linear function.
Since the
polyline consists of straight line segments connected end to end, you can define a function that is
a series
of linear equations, each applicable to a specific interval of x values. This method exactly
represents the
polyline as a mathematical function but in a piecewise manner.
2. Polynomial Interpolation
Polynomial interpolation involves finding a single polynomial function that passes through all the
points of
the polyline. One of the most common methods is the Lagrange polynomial, which can provide an exact
fit for
the points. However, high-degree polynomials might exhibit undesirable oscillations between points
(Runge's
phenomenon), especially with a large number of points.
3. Spline Interpolation
Spline interpolation, particularly cubic splines, is often used for approximating polylines. A cubic
spline
is a series of piecewise cubic functions that pass through the points, with constraints applied to
ensure
the curve is smooth at the points where the pieces meet. This method is advantageous because it can
provide
a smooth approximation that closely follows the polyline, without the oscillations associated with
high-degree polynomials.
4. Least Squares Approximation
If the polyline is not strictly "functional" or if you seek a simpler function to approximate a
complex
polyline, you can use the method of least squares to find the best-fitting curve of a chosen type
(linear,
quadratic, cubic, etc.). This method minimizes the sum of the squares of the vertical distances of
the
points from the curve, providing an approximation that may not pass through all points but offers a
good
overall fit.
5. Regression Analysis
For data that exhibit a specific trend or pattern, various regression techniques (linear regression,
polynomial regression, logistic regression, etc.) can be used to find an approximate mathematical
function.
Regression analysis is particularly useful in statistical modeling and can provide insight into the
relationships between variables.